
Your A/B test says the new page won. Did it?
On this test the new pricing page started more trials and converted worse. Both numbers are correct, they name opposite winners, and the thing that separated them was the rollout schedule.
What is an A/B test?
An A/B test shows two versions of the same thing to comparable groups at the same time, and lets the difference between them tell you which to keep. The simultaneity is the part that makes it a test rather than a comparison.
Without one you ship the change and compare this month to last month. That is also comparing two things, and it answers nothing: the season moved, the campaigns moved, the traffic mix moved. Three things changed and only one of them was your page. Running both versions over the same weeks holds everything else still, so the page is the only thing that differs.
The mistake this example is about
A test can be perfectly sound and still be read wrong. The readout most dashboards lead with is the count of conversions, and a version shown to more people accumulates more conversions however badly it performs.
That matters because nobody ships a new page to everyone on day one. You give it a slice of traffic, then more, then most. That ramp is sensible engineering, and it is enough to crown the version that is losing.
Watch it, at whichever depth you want
The numbers
Four weeks, two pricing pages, one outcome: did the visitor start free.
On raw conversions the new page wins. It started 140 trials against the old page's 126. On that reading you ship it.
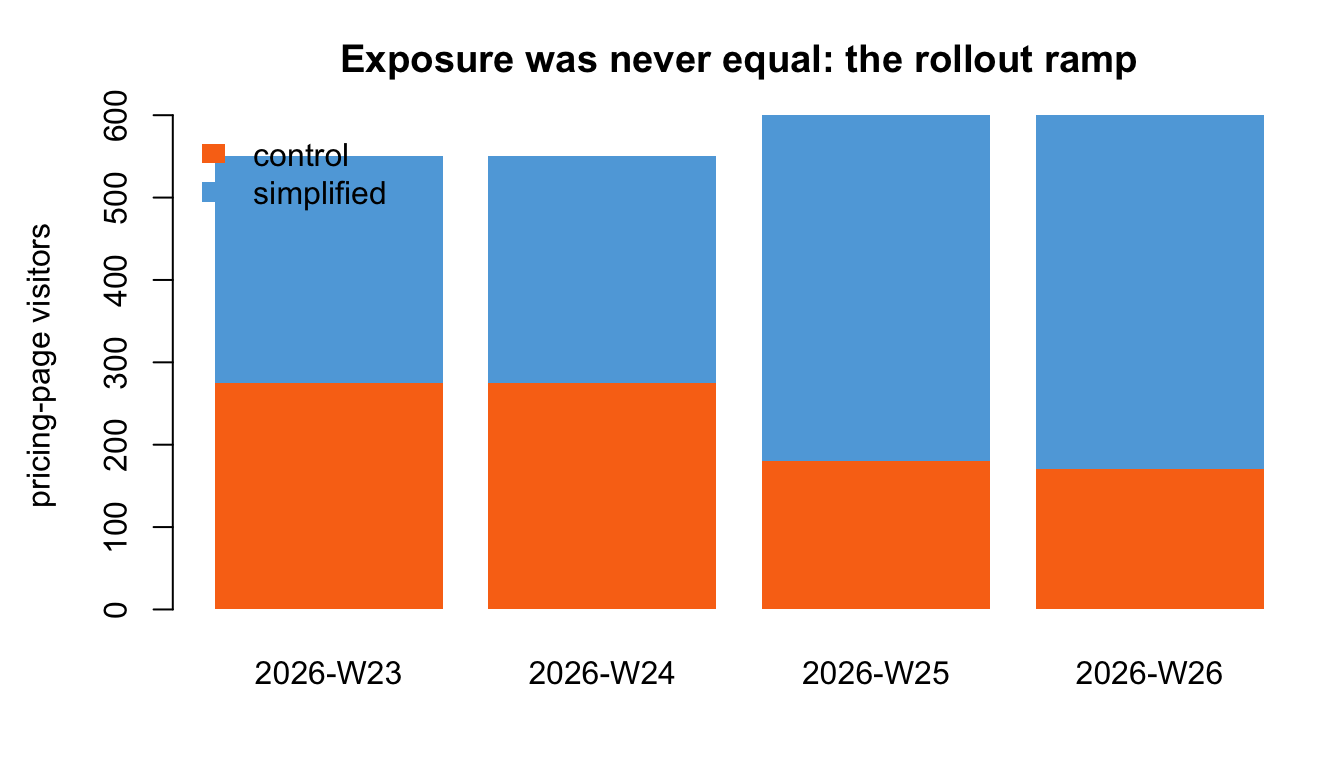
Then ask the question the count does not answer: 140 out of how many? The old page was shown to 900 visitors, the new one to 1,400, because it was ramping. Divide by the people who actually saw each page and the result turns over.
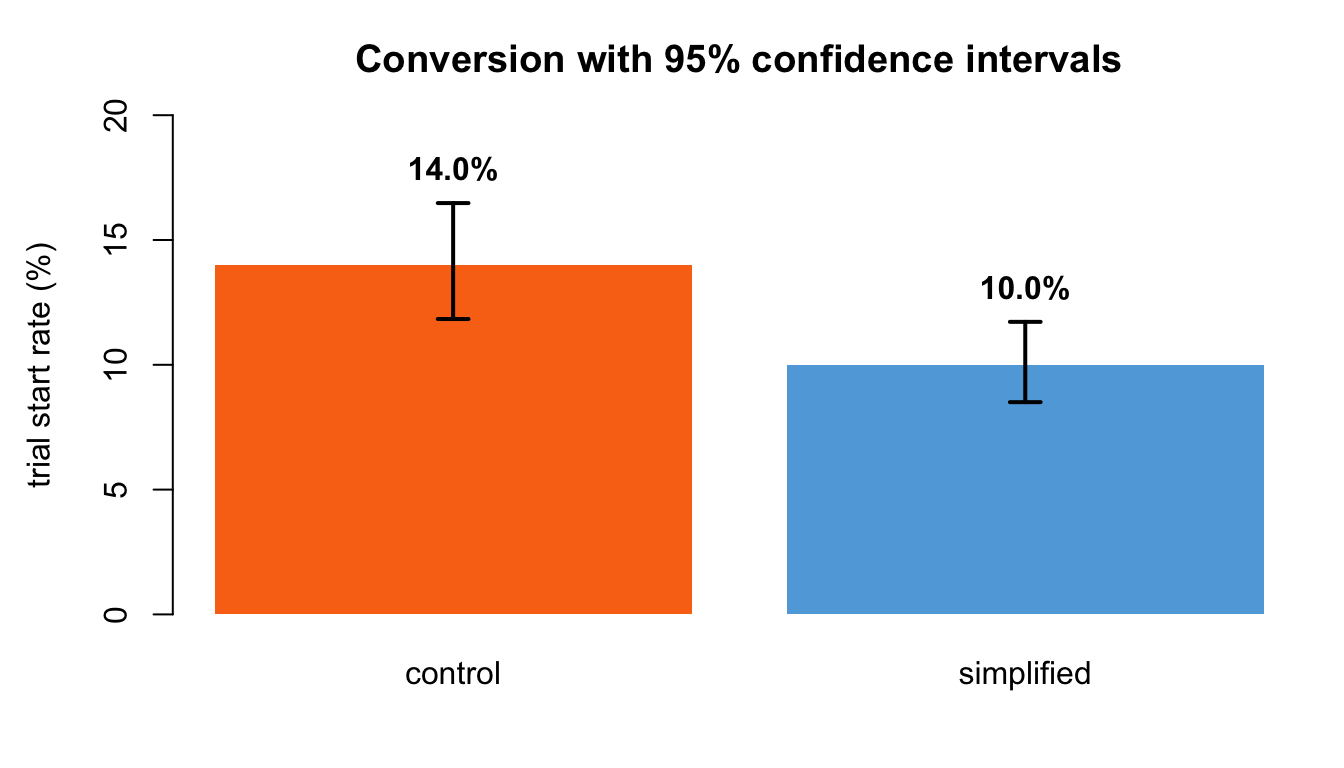
The gap is real: a two-proportion test returns p = 0.0042274, so chance alone produces a gap this large about four times in a thousand. But a p-value says whether, never how much. The 95% interval runs from 1.15 to 6.85 percentage points. Real, and possibly modest. Report both.
It was not the ramp that broke the test
This is the sentence most likely to be misremembered, so it is worth stating plainly: unequal exposure is not bias, and it does not invalidate anything. Every visitor was still assigned at random, so comparing the two rates is fair. What the ramp destroys is one particular summary of the test, the raw count.
You can check that the reversal is not an artifact of the ramp by breaking the four weeks apart. The split ran even for two weeks, then tipped to roughly 70% toward the new page. The old page led on rate in every single week.
What the analysis needs from your data
One row per visitor: which page they saw, and whether they started a trial. That is the whole contract, and it matters more than it sounds.
Totals do not decompose. A team that stored only "trials per page" has already thrown the denominator away, and no tool can recover it. The denominator only exists at row level.
Here are the first rows of the file, exactly as the analysis reads them:
visitor_id,visit_date,variant,started_trial
v_00001,2026-06-12,control,0
v_00002,2026-06-26,simplified,0
v_00003,2026-06-08,control,1
Download and re-run it
Two files. The R Markdown source produced every figure and number above; the CSV is the data it ran on. Re-knitting reproduces the dataset byte for byte from a fixed seed.
Released under CC BY 4.0.
Why this matters to the business
Three short cuts, each on one question you might be asked before a decision.
Why do I care?
We shipped the winner. Why did nothing happen?
The test says we won. How sure is that?
We ramp every launch. Does that break the test?
The honest limit
The figures above are agreed three ways: the notebook's own R run, R's prop.test,
chisq.test and fisher.test called directly, and an independent
Python reimplementation using scipy. They agree to every digit shown.
Two things this example does not establish. The conversion rates land on exactly 14.0% and 10.0% because the generator fixed the per-week counts rather than simulating from a probability; real data does not land there, and the tidiness is not evidence of anything. And while our own tool ran on this dataset and the job succeeded, the report was never opened, so the tool's output has not been compared figure by figure against this notebook.
The brief for an AI agent
If an AI assistant is choosing a method for you, it needs different things than you do: the discriminating condition, the questions this gets mistaken for, the failure modes that return a plausible number instead of an error, and figures it can cite rather than generate. We publish that as its own document, written to one bar: an agent asked whether to run this analysis should be able to answer from it alone, including saying no.
Where this came from
Your turn
Bring your own data and the question you actually need answered.
CympleData Scientist Send me your data and question, I’ll send you the analytics. ds@mcpanalytics.ai