
Where Do You Draw the Line? Choosing a Classification Threshold
Updated October 2026
A score ranks cases. A threshold decides which ones you act on. Where it goes is a business decision, not a technical default.
A score ranks cases. A threshold decides which ones you act on [2]. A churn score, a fraud score or a lead score puts each case on a line from low to high. Nothing happens until you pick a point on that line and act on everything above it [2]. Our framing: that point is a firm's choice, not a technical default. Each cutoff trades false alarms against misses [2]. The usual rules do not agree on where the best cutoff is [1][3]. The right one depends on what a false alarm and a miss each cost you. A default of 0.5 does not know that [4]. This page covers what a threshold does, the trade-off, the named rules, the traps, how to tell whether a result is flattering itself, and what our free tool does.
Also on this topic: the business version, choosing a cutoff on a churn score and the version for analysts, with a medical example.
The answer first: a cutoff is a firm's choice
A score only ranks cases. The threshold, or cutoff, is the point on the score where you start to act. Moving it changes who gets flagged, and no setting is right for everyone, because the right one depends on what a false alarm and a miss each cost you [2] [4].
In plain words: a false alarm is a case you flag that did not need it. A miss is a case you did not flag that did.
What this means for you
- Name what a miss and a false alarm cost you before you pick a cutoff. A default of 0.5 does not know your costs [4].
- Pick the rule whose weighting matches the choice. F1, Youden's J and a cost-based cutoff can name different places on the same score [1] [3].
- Do not trust a cutoff picked on the same rows that score it. It will look better than it will on new data [6].
What a threshold is and what it does
A classifier outputs a continuous score. A threshold labels anything above it positive [2]. Each threshold gives one pair of rates, the false positive rate and the true positive rate, and sweeping the threshold across all values traces the ROC curve [2]. Our reading of the definitions. Raising the threshold cuts false positives and adds false negatives.
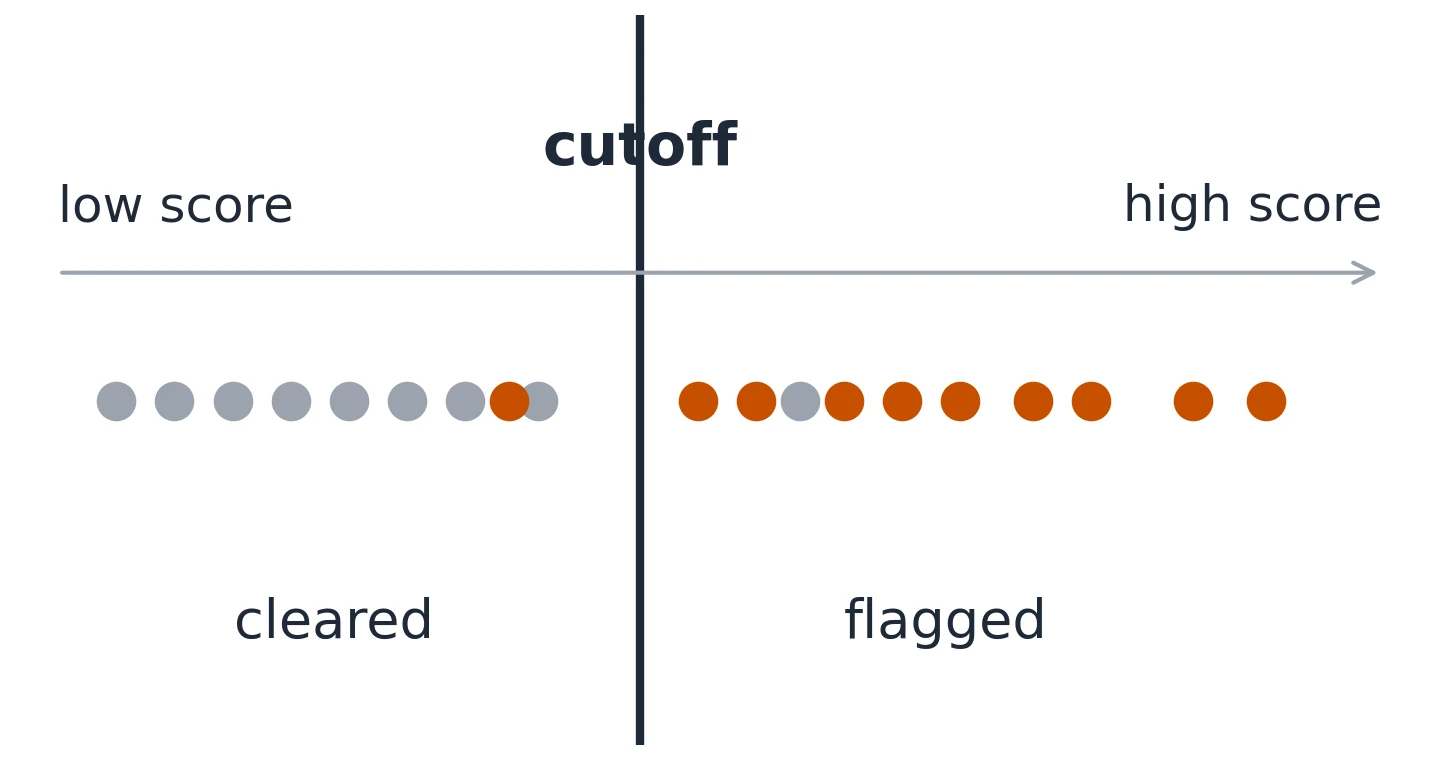
In plain words. Move the cutoff right and you flag fewer cases, so fewer wrong flags and more missed ones. Move it left and the reverse happens.
Precision, recall and the trade-off
Precision is the share of flagged items that are truly positive [1]. Recall, also called sensitivity or the true positive rate, is the share of all truly positive items that are found [1]. Precision and recall often move in opposite directions [1]. The source's examples are a smoke detector, which favors recall, and the justice system, which favors precision [1].
Our reading for a business. Precision answers "of the people we flagged, how many were worth flagging", and recall answers "of the people who mattered, how many did we catch". Raising the cutoff tends to lift the first and lower the second [1][2].
F1 vs Youden's J vs a cost-based cutoff: the named rules
Three rules for choosing a cutoff come up again and again. They are unlike questions, so they can name other cutoffs.
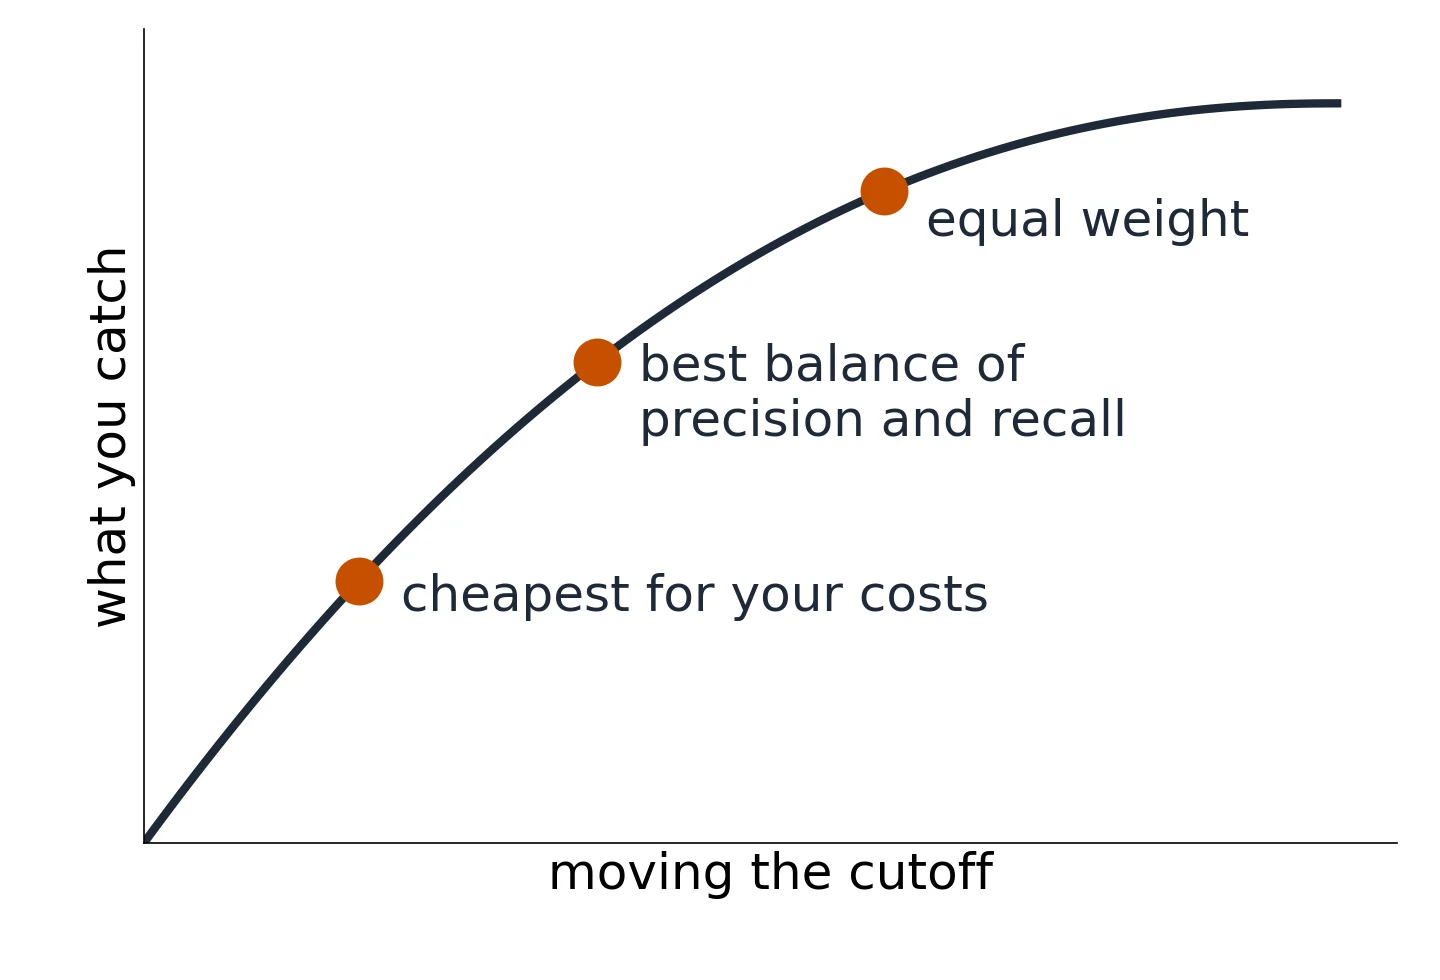
F1. F1 is one score that mixes precision and recall. It is their harmonic mean, a kind of average that stays low unless both are high. It weights them the same [1]. The F-beta family shifts the weight: F2 favors recall and F0.5 favors precision [1]. F1 ignores the true-negative cell, which the source calls a problem outside information retrieval [1].
Youden's J. J is sensitivity plus specificity minus 1 [3]. It runs from -1 to 1. The index is zero when the test gives the same proportion of positive results in both groups, which means the test carries no information [3]. Its maximum can serve as the rule for a cutoff, and graphically it is shown as the height above the chance line [3]. It weights the false-positive rate and the false-negative rate the same [3]. Our reading of the formula. Because sensitivity and specificity are each computed within one true class, prevalence does not enter it directly.
A cost-based cutoff. This one needs two numbers from you. What a false alarm costs and what a miss costs. ROC analysis is tied to cost-benefit reasoning, with true positives as benefits and false positives as costs [2]. Our own math, assuming the score is a calibrated probability (a predicted 0.7 means roughly seven in ten of those cases are positive). Flag a case when its expected cost of being missed is larger than its expected cost of a false alarm. That puts the cutoff at the cost of a false alarm divided by the sum of the two costs. If a miss costs far more than a false alarm, the cutoff falls well below 0.5. This is our derivation, not a sourced rule. It holds only for calibrated probabilities.
No one rule is the answer. They weight the two errors differently, so on the same score they can pick other places [1][3]. Our reading: pick the rule whose weighting matches the choice.
| Rule | How it weights the two errors | What you supply |
|---|---|---|
| F1 | Precision and recall equally [1]. | Nothing. |
| Youden's J | The false-positive rate and the false-negative rate the same [3]. | Nothing. |
| A cost-based cutoff | By the costs you set. | What a false alarm costs and what a miss costs. |
Why 0.5 is not a default to trust
The scikit-learn documentation predicts positive above an estimated probability of 0.5 by default, and says hard-coded cutoffs are not ideal for most use cases [4]. Its example is medical screening, where a missed cancer costs far more than a false alarm. It may be more beneficial to flag at a probability much lower than half [4]. The same logic applies to a score in a business. If losing a customer you could have saved costs far more than a retention offer sent to someone who was staying, the cutoff should sit lower than the default. The reverse if the offer is expensive. Tuning a threshold gives unlike class labels from the same predicted probabilities, and so the same ROC and precision-recall curves [4].
Traps
Rare positives. When the positive class is rare, accuracy misleads, because predicting the common class each time already scores high. A majority-class baseline, always predicting the common class, is a bar that accuracy must clear. That is our framing, not a sourced claim. The ROC article says ROC analysis can select models independently of, and before specifying, the cost context or the class distribution [2]. It also notes that a high ROC AUC might correspond to low values of precision and negative predictive value [2]. Saito and Rehmsmeier say ROC plots can be deceptive on imbalanced datasets and strongly recommend precision-recall plots there [5].
A score that is not a calibrated probability. A score from a model is often just a ranking. The cost-based cutoff above is our own math and holds only if a predicted 0.7 really corresponds to about seven in ten positives. If the score is not calibrated, the cost formula does not apply. The cutoff should be read off the data instead.
Choosing the cutoff on the same rows that score it. Choosing and scoring on the same data looks better than it will on new data. The optimism grows when the data is small [6]. Tuning a threshold on training data risks overfitting, and scikit-learn's tuner uses cross-validation by default [4].
Too few cases of a class. A cutoff needs enough of each class to be read at all. Our free tool refuses to run without them. No source we read gives a universal minimum.
How much of the result is flattery
When a cutoff is picked because it scores best on the rows in hand, the score it earns there is the best of many tries. The bootstrap gives one way to look at this. Draw new sets of rows from your own rows, many times, work out the result on each new set, and see how much it moves [7].
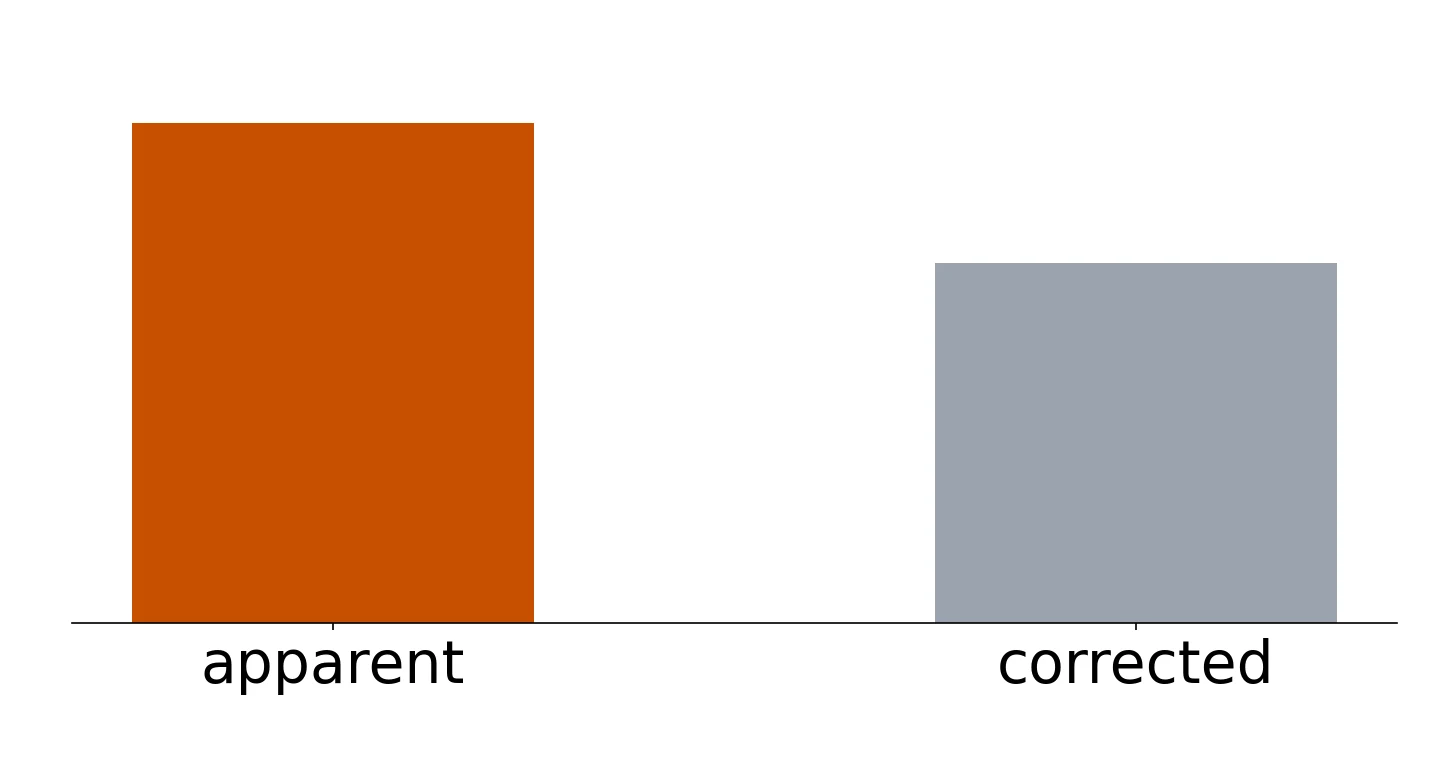
Our free tool uses that idea for an optimism step, described in the next section. We label it as what our tool does, not as a rule from a source. Treat the result as an estimate of the flattery. It is not a promise that the corrected figure is what fresh data will show.
How to run it on your own file
- Bring a file with two columns: what actually happened (yes or no) and the score for each case.
- Add your costs if you know them: what a false alarm costs and what a miss costs.
- Read the criteria side by side, not one cutoff alone, and see which weighting matches your decision.
- Read the optimism note. It estimates how much the cutoff flatters the result on your own rows.
Run the free threshold optimizer on your own scored file.
What you need and what you get back
What your file needs: both classes, a minimum number of rows of each, and a score that is not constant. Costs are optional.
What you get back (these are facts about our tool, not general rules):
- It treats each observed score as a candidate cutoff and flags a row when its score is at or above the cutoff.
- At each cutoff it reports the confusion counts, precision, recall, specificity, F1 and accuracy. The expected cost if you supply costs.
- It shows several rules side by side. The cutoff with the highest F1, the one with the highest Youden's J, the cheapest cutoff if you supply a cost for a false alarm and for a miss, and cutoffs that meet a target precision or a target recall. The targets have defaults of our own choosing if you give none. With no costs, it picks no cutoff for you.
- For each cutoff it states the range of cost ratios, the cost of a miss over the cost of a false alarm, for which that cutoff is the cheapest. Some cutoffs are the cheapest for no ratio at all.
- It needs both classes, a minimum number of rows of each. A score that is not constant. It calls the positives rare at a line of its own choosing, and then does not lead with accuracy.
- Its optimism step resamples the rows, lets each resample pick its own highest-F1 cutoff, scores that cutoff on the original rows, and reports the average gap as the stated optimism. Only the highest-F1 cutoff is resampled. The stability of a cost-chosen cutoff is not measured.
- If you give costs and a score between 0 and 1, it shows the cutoff that a perfectly calibrated probability would imply. It says the score is poorly calibrated when the gap is large. What counts as large is our own choice.
- The companion tool, ROC analysis, answers the separate question of how well the score ranks at all. The threshold optimizer takes the ranking as given.
How we checked it
Three things to know about how this page was written.
Every claim has a source or a label
Each statement is tagged to the numbered reference it came from, or marked as ours. Our own framing and algebra are not presented as sourced rules.
Our tool is described as ours
What the free tool does is stated as facts about our tool, not as rules from a source. Its choices, such as defaults, are its own.
No numbers from a dataset
This page uses no data, so it gives no good score, no typical cost ratio and no benchmark. The churn and breast-cancer articles show the idea with numbers.
Questions people ask
What is a classification threshold?
The cutoff on a score above which a case is labelled positive [2].
Is 0.5 the right cutoff?
Not automatically. The scikit-learn page uses 0.5 as its default and says hard-coded cutoffs are not ideal for most use cases [4]. The right cutoff depends on what the two kinds of error cost.
How do I pick between F1, Youden's J and a cost-based cutoff?
F1 weights precision and recall the same [1]. Youden's J weights false positives and false negatives the same [3]. A cost-based cutoff uses the costs you supply. Pick the one whose weighting matches your choice. That is our reading.
How do I turn the cost of a miss and a false alarm into a cutoff?
Our own math, for a calibrated probability only. The cost of a false alarm divided by the sum of the two costs. It is not a sourced rule.
What if the positive class is rare?
Our reading. Accuracy misleads. A high ROC AUC might go with low precision [2]. Precision-recall plots are recommended there [5]. Look at precision and recall.
Does choosing the cutoff on my own data flatter the result?
Yes, it tends to, more so when the data is small [6]. A resampling step can estimate how much [7].
How is this different from an ROC curve?
The ROC curve shows each cutoff's pair of rates [2]. A threshold choice picks one point on it.
Does the cutoff need calibrated probabilities?
Our cost-based math does. The other rules in this page work on any score that ranks cases.