
Incremental impact is the extra outcome an action caused. You estimate it by comparing a group that got the action with a randomly chosen group that did not. Credit is a different number: it is what a dashboard attributes to an ad or a campaign, whether or not the purchase would have happened anyway [1] [2]. The gap between the two can be large. In 15 Facebook campaigns run in 2015, methods that compare people who saw ads with people who did not, without randomizing, were off by a factor of three in the estimated lift in purchases in half of the studies [3]. The methods mostly overestimated the lift, though in some studies they underestimated it [3]. Across 663 Facebook experiments run in 2019 and 2020, neither double machine learning nor stratified propensity matching performed well [4].
Credit is not cause
Attribution assigns credit for a purchase across the touchpoints that came before it. Incrementality asks a different question: how many of those purchases would have happened anyway, without any advertising spend [2]? Google's own guidance says the two are "not at all the same thing" [2].
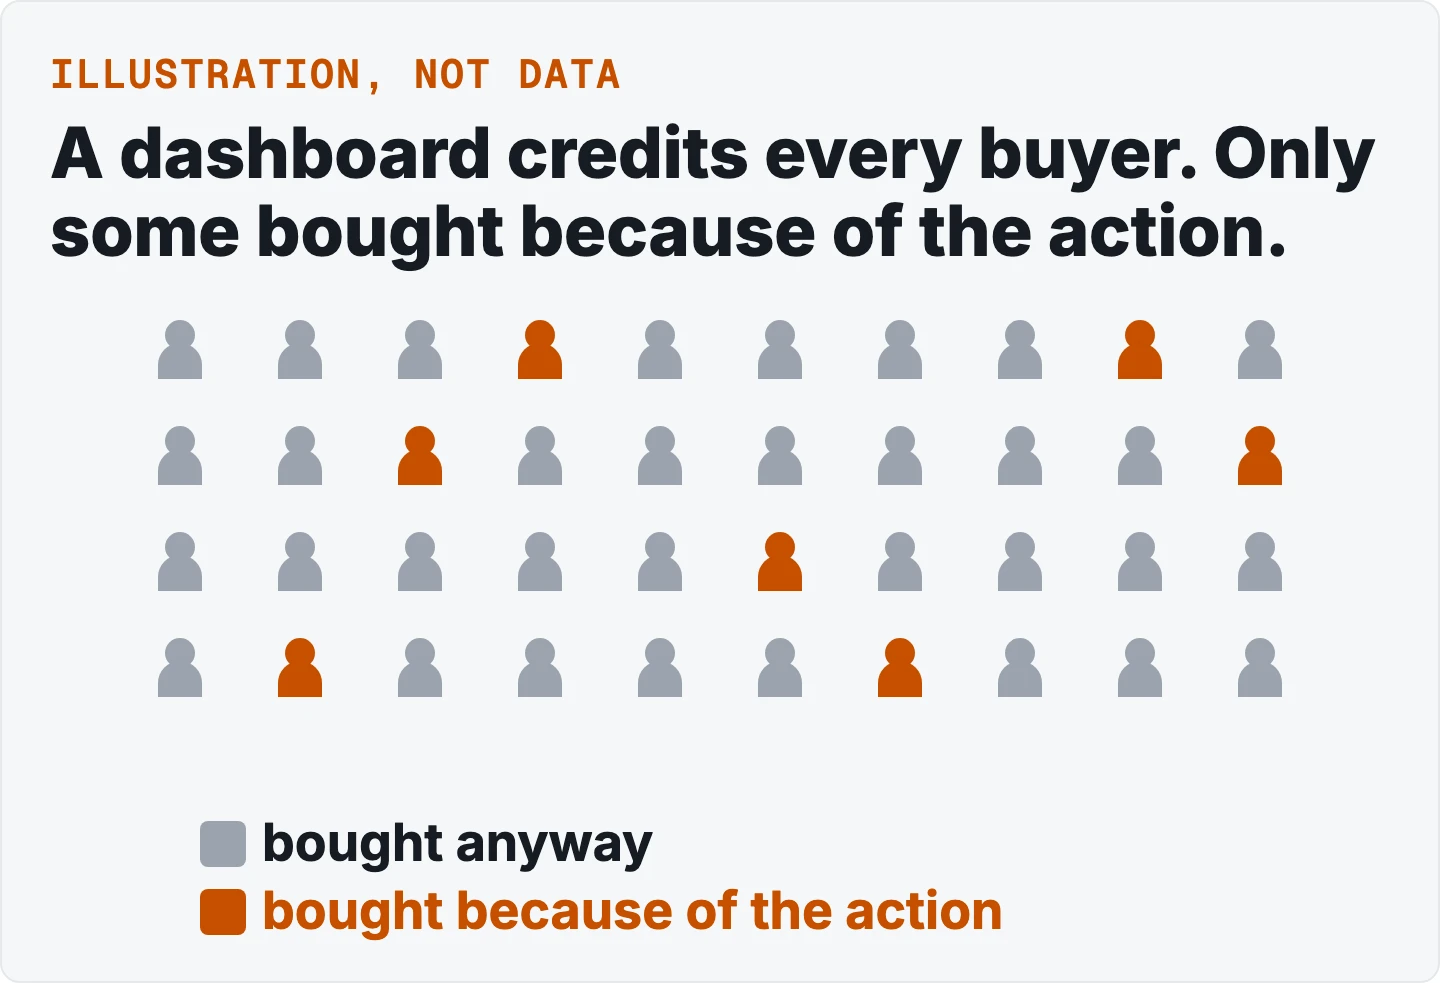
Here is what that looks like in a real test. eBay switched off its brand-keyword ads on Yahoo! and MSN, the ads shown to people who searched for eBay by name. 99.5 percent of the clicks were retained without paying for them, because shoppers who typed "eBay" found the site anyway [5]. The experiment showed they had no measurable short-term benefit [5].
That is the reason the comparison has to be randomized. People who see an ad can differ from people who do not in ways that also affect purchases, such as how often they search or visit [5] [3]. Compare them and you measure those differences along with the effect of the ad.
How to measure it
The default design is a random holdout. Take one audience, flip a coin for each person, send the action to one group and leave the other group out [1] [6] [7]. Run both groups in the same window, with the same treatment except for the one thing you are testing.
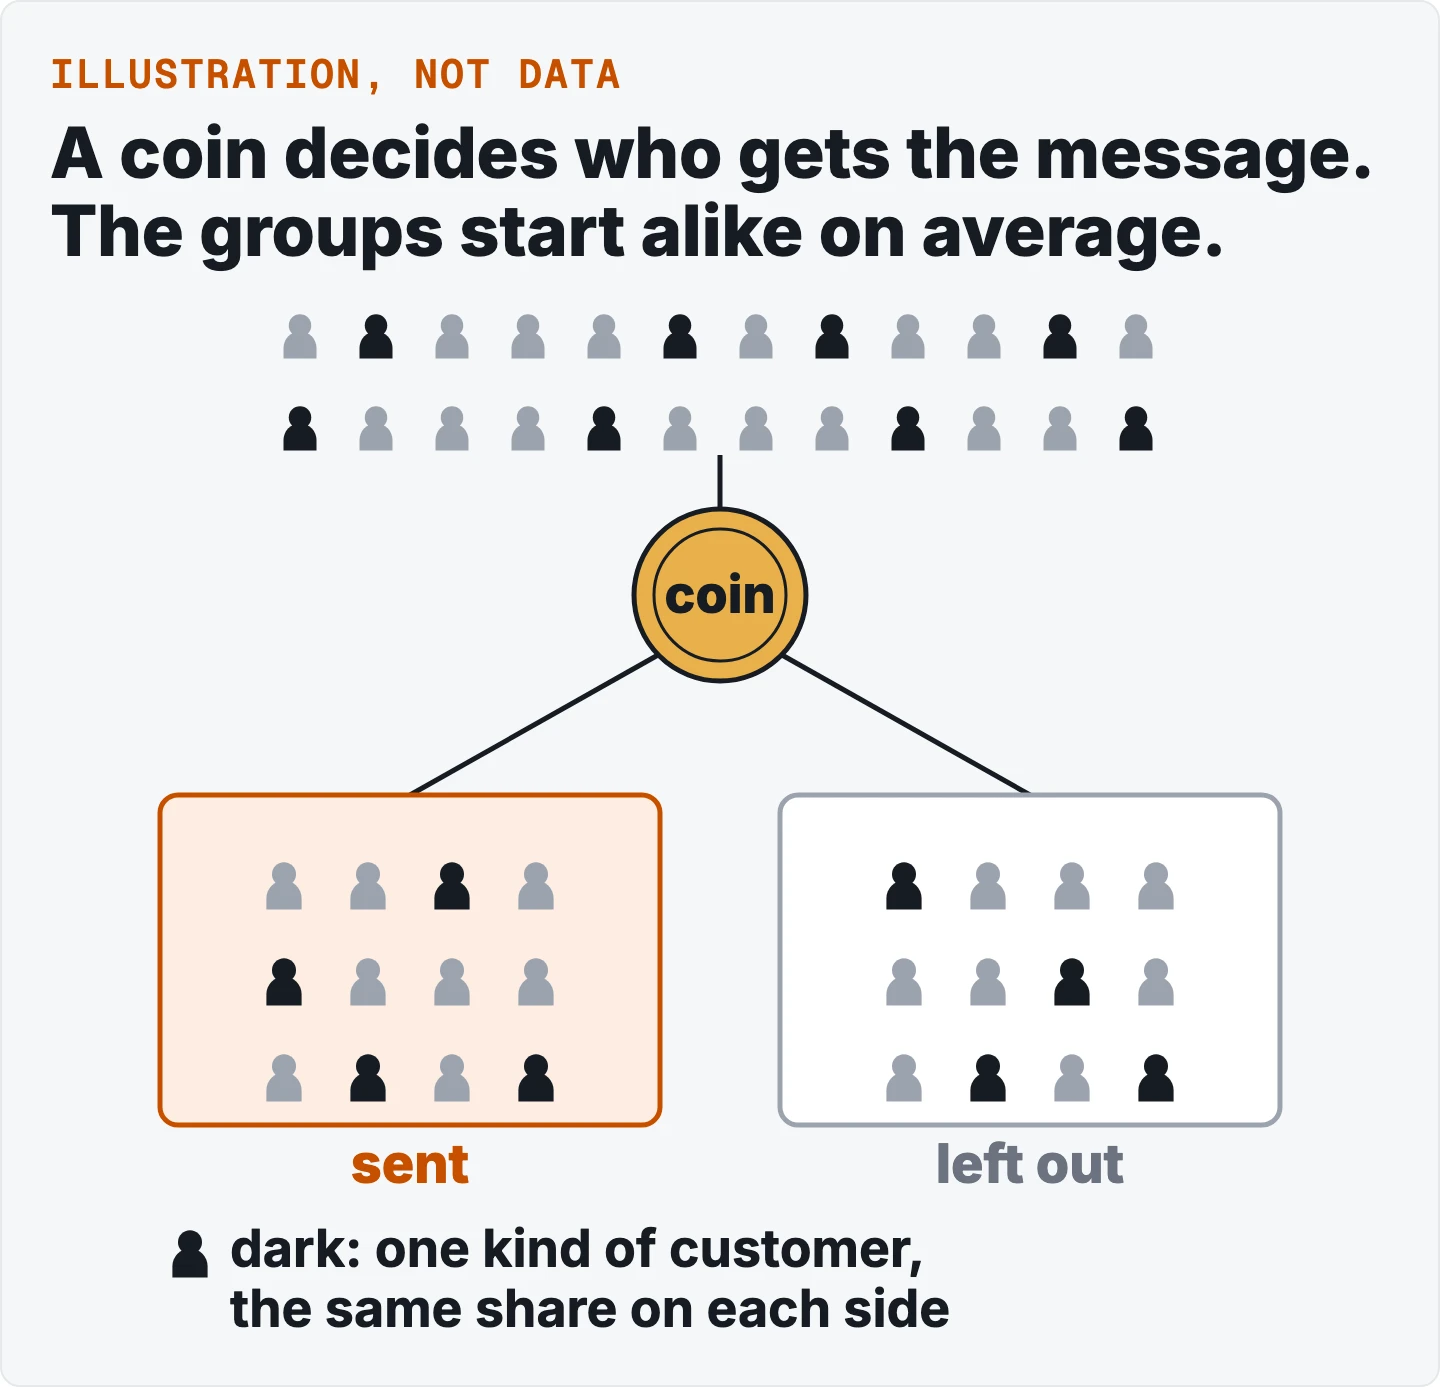
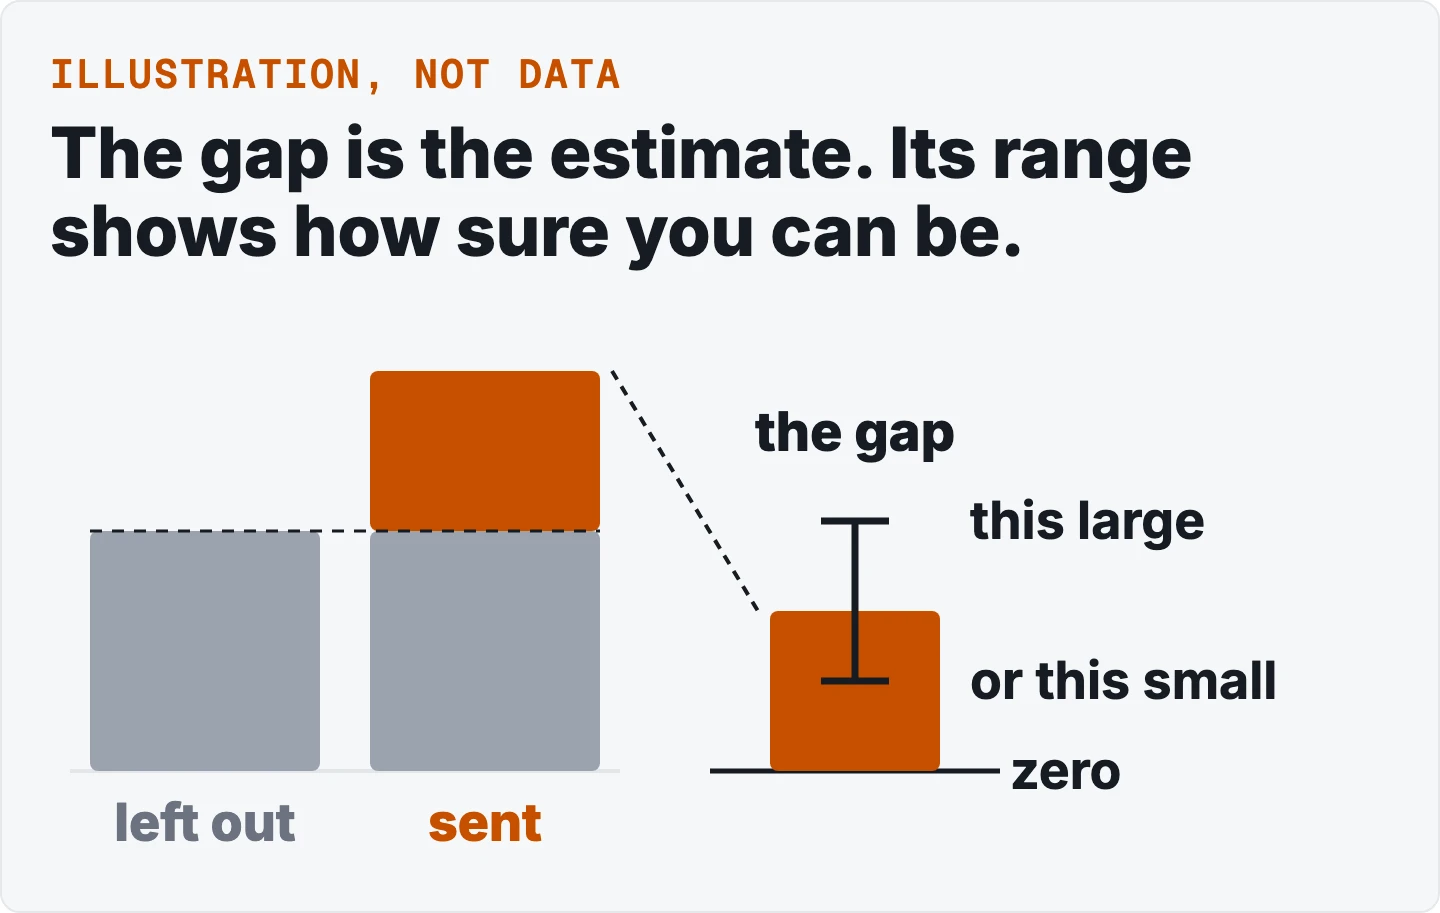
Because the groups are alike on average, the difference in their purchase rates is the estimated incremental impact, and it comes with a 95% range that says how far to trust it.
Keep people in the group they were assigned to, even if some of them did not receive the action or some in the left-out group got it another way. That is called intent-to-treat. A standard textbook defines it as the effect of assigning people to the action, not of the action itself [8]. It preserves the fairness the coin flip created.
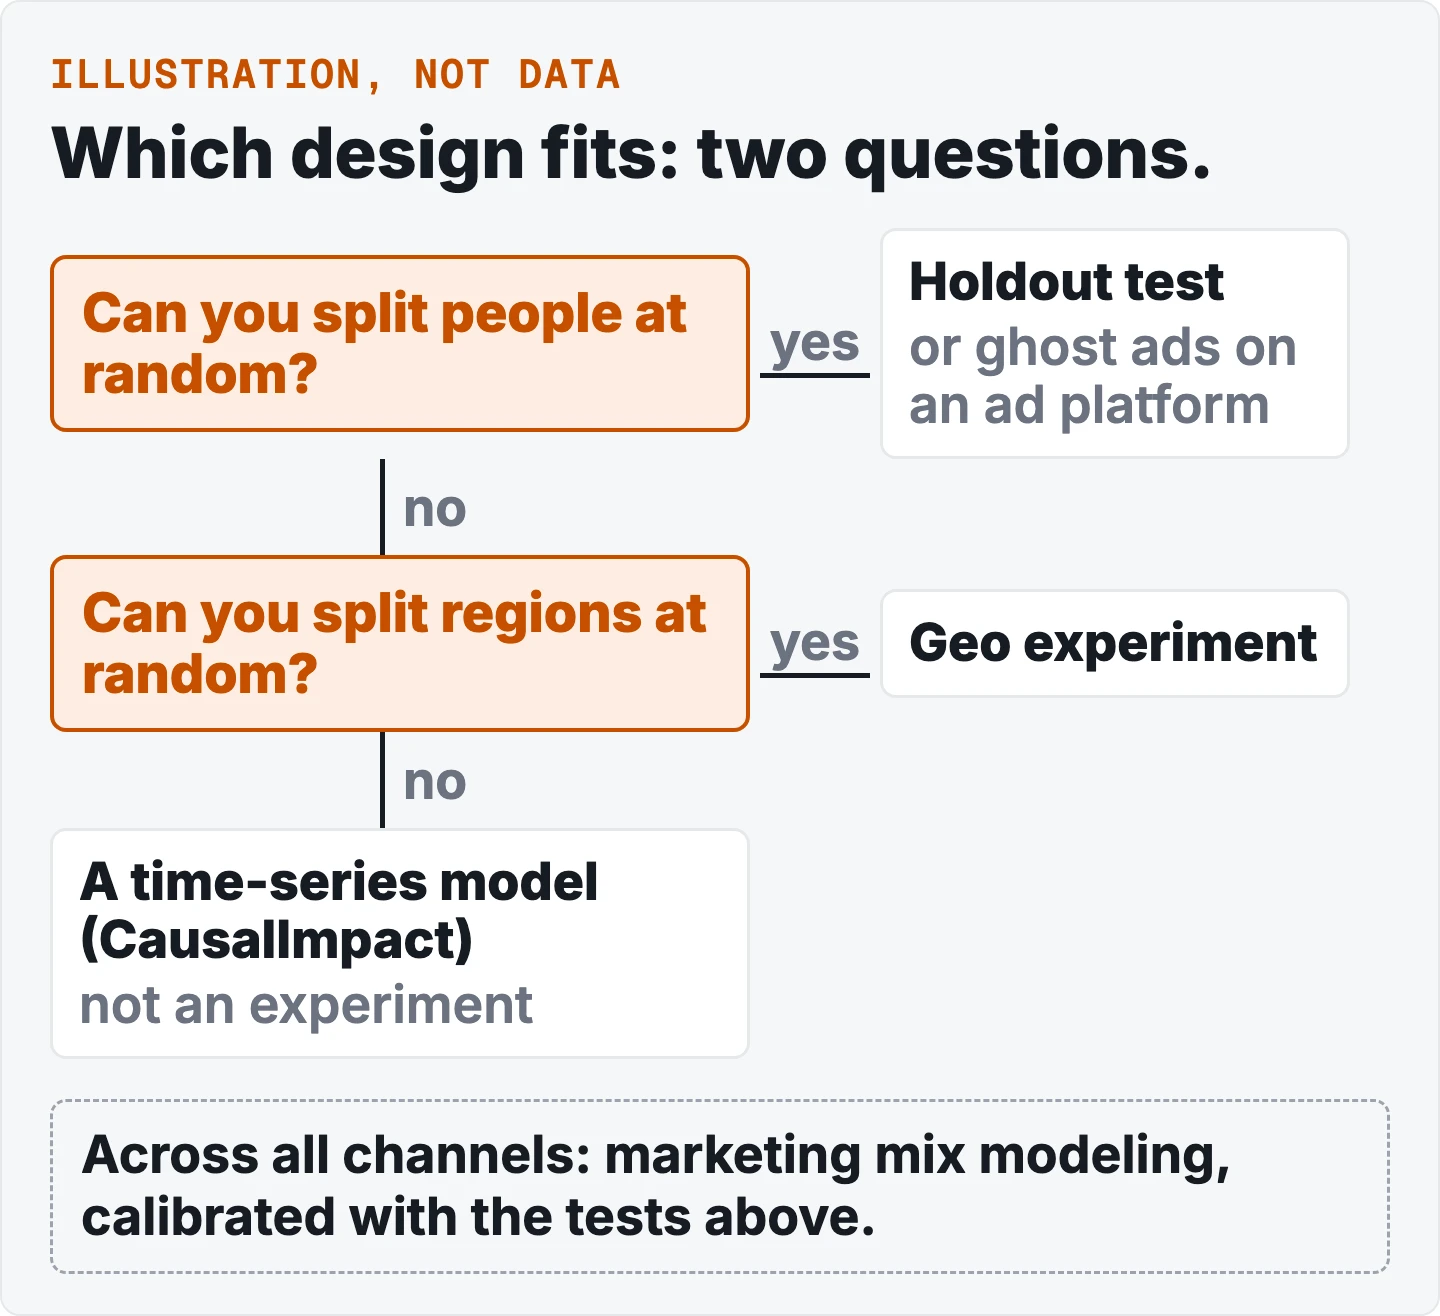
Several designs answer the same question when a plain holdout does not fit:
| Design | When it fits | What can go wrong | Ref |
|---|---|---|---|
| Randomized holdout (people) | You control who gets the action | Left-out people may still see the action elsewhere; the test needs enough volume | [9] [1] |
| Ghost ads | A platform can identify who would have seen the ad | Needs platform-side access; running campaigns at the same time can interfere | [9] |
| Geo experiment | You cannot split people, but you can split regions | Delivery has to follow the plan by region; spend and results must be tracked by region | [10] |
| Difference-in-differences | You changed some places or groups and not others, and have data from before and after for both | Assumes both would have moved together without the change; there is no statistical test for that; plotting many points before the change helps | [11] |
| Synthetic control | One or a few places changed, a pool of untouched places, a long history | If no blend of untouched places matches the changed one before the change, do not use it; unlike places can bias it, and the change can spill into the pool | [12] |
| CausalImpact | A time series with comparison series | Non-experimental; not a substitute for a randomized test | [13] |
| Marketing mix modeling, calibrated with lift tests | You want a portfolio view across channels | Needs roughly two years of weekly data and a lift result to calibrate it | [14] |
A classic case of difference-in-differences: Card and Krueger compared fast food restaurants in New Jersey and Pennsylvania before and after a minimum wage rise in New Jersey [15]. CausalImpact predicts what would have happened after the change from comparison series. It estimates the missing group; it does not randomize it.
How to read the number
Lift can be written several ways, and they are not interchangeable. Say which one you mean.
Absolute lift is the extra conversions: conversions in the group that got the action minus conversions in the left-out group. Google calls this "incremental conversions" or "Absolute Lift" [16]. Relative lift divides that extra by the left-out group's conversions. Google says it "can theoretically scale between -1 and infinity", warns it can be very large when the left-out count is small, and warns it can mislead when compared across studies [16].
Percentage points and percent are different. The UK Office for National Statistics gives this example: a value of 10 percent falling by 1 percentage point becomes 9 percent, while a fall of 1 percent would give 9.9 percent [17].
Cost per extra conversion is total spend divided by incremental conversions, which Google calls incremental cost per action. In Google's own example, $10,000 spent and 800 incremental conversions gives $12.50 [16]. Incremental return on ad spend is incremental conversion value divided by total spend [16].
Whatever number you use, say what it is divided by. Google says Conversion Lift counts net new conversions separately from standard conversion tracking [16].
When you have few conversions
Small effects need very large samples. Lewis and Rao (2015) ran 25 large field experiments with US retailers and brokerages. The median 95% range on return on investment was over 100 percentage points wide, and tests that could tell you something useful could need more than 10 million person-weeks [18].
If your volume is low, you have four honest options:
- Hold out more people. A larger holdout makes a small effect easier to see, and it costs reach, because the left-out group does not get the action. One practitioner source offers 5 to 10 percent of customers for high-volume tests as a rule of thumb, not a law [19].
- Run longer. More time means more purchases in both groups. Google advises longer studies when the delay between action and purchase is long [1].
- Use a geo design. Split regions instead of people [10].
- Accept a wide range and say so. A result such as "a range that runs from below zero to a large gain" is a real answer. It tells you the test was too small to settle the question.
Work out the smallest effect your test could detect before you run it, using your real baseline rate, the size of each group and the planned length [19]. An independent sample-size calculator needs four inputs: your baseline rate, the smallest effect to detect, the power and the significance level [20] [21]. Platforms set their own minimums for lift studies and they change, so read the platform's current page before you plan [1].
What it is not
Attribution gives credit across touches. It answers where to assign a purchase, not whether the action caused it [2].
A before and after comparison attributes every change in the world, such as season, price, or competition, to the action.
A comparison of people who chose to act with people who did not. The people who chose differ from the rest, which is the problem the coin flip removes [3].
What goes wrong in practice
- The left-out group still sees your other campaigns. If only some campaigns are measured, the holdback group can still meet your others, which can shrink the lift you detect [1].
- People cross over. Some in the left-out group get the action another way. Keep them in their assigned group [4].
- One person's treatment changes another's outcome. This is interference, and concurrent campaigns can cause it. Run one at a time, or aim them at distinct people [9].
- Delivery does not follow the plan. In a geo test, ads must reach the regions you chose and no others [10].
- Switching the goal after you look. Decide the one number that decides the test, the window and when you stop before you start, and write it down. Guidance for randomized studies asks for the main outcome to be fixed in advance and any change reported with reasons [22] [23]. Stopping the first time a result looks significant raises the false-positive rate [24].
- The window is wrong. A longer window picks up late purchases and adds noise. A test measures only its own window, so it cannot show effects that last beyond it, such as carry-over [5] [14].
Three questions tell you whether to trust a result. Was the split random? Did both groups get the same treatment except the one thing you tested? Does the 95% range stay clear of zero, and is the extra big enough to matter?
See it done with numbers
The business version · The analyst version
Try it on your own file with the free incrementality test.
Questions people ask
What is incrementality in marketing?
It is the extra outcome a marketing action caused, such as additional purchases that would not have happened without it. You estimate it by comparing a group that got the action with a randomly chosen group that did not. It differs from credit, which is what a dashboard attributes to the action whether or not the purchase would have happened anyway [2].
What is the difference between incrementality and attribution?
Attribution assigns credit for a purchase across the touchpoints that came before it, and works well for day-to-day, always-on reporting. Incrementality asks whether the purchase would have happened anyway, and it is measured with a randomized experiment, often called a lift test [25].
How do I test incrementality with low conversion volume?
Use a larger holdout, a longer test, or a geo design, and work out the smallest effect you could detect before you start. Small effects need very large samples: in 25 retail and brokerage experiments the typical range on return on investment was over 100 points wide [18]. If the range is too wide to settle the question, say so, rather than reading the middle of it as the answer [18].
Did my promotion or retargeting drive extra purchases, or would those customers have bought anyway?
The same holdout logic applies to any action: leave a random group out and compare. In one retailer's retargeting campaign, a randomized test estimated that the ads lifted site visits by about 17 percent and sales by about 11 percent, among users the method predicted would see the ads [9]. Those are advertising results. Your own answer comes only from your own test.
How big should the holdout be?
It depends on your baseline rate and how small an effect you need to see. One practitioner source gives 5 to 10 percent of customers for high-volume tests as a rule of thumb, and says it is not a law. A larger holdout detects small effects more easily and costs more reach [19].
How long should a test run?
Long enough to include the delay between the action and the purchase. Google advises running longer when that delay is long [1]. A longer window also picks up late purchases and adds noise [14].
Do I still need incrementality tests if I run marketing mix modeling?
Yes. A marketing mix model is a regression on aggregated data, and its authors recommend calibrating it with lift or geo-experiment results, matched on granularity, metric and period [14].
References
- Google. About Conversion Lift; Set up Conversion Lift based on users. Google Ads Help. About · Set up
- Google. Get a grip on marketing incrementality. Think with Google. Article
- Gordon, B., Zettelmeyer, F., Bhargava, N. and Chapsky, D. (2019). A Comparison of Approaches to Advertising Measurement: Evidence from Big Field Experiments at Facebook. Marketing Science 38(2). Working-paper draft, April 2018. Draft (PDF)
- Gordon, B., Moakler, R. and Zettelmeyer, F. (2022). Close Enough? A Large-Scale Exploration of Non-Experimental Approaches to Advertising Measurement. arXiv
- Blake, T., Nosko, C. and Tadelis, S. (2015). Consumer Heterogeneity and Paid Search Effectiveness: A Large Scale Field Experiment. Econometrica; NBER Working Paper 20171. NBER (PDF)
- Meta. Conversion Lift. Page
- TikTok. Conversion Lift Study. Page
- Hernán, M. and Robins, J. (2020). Causal Inference: What If. Chapman and Hall/CRC. Intention-to-treat is defined in Chapter 22, section 22.1. Book page
- Johnson, G., Lewis, R. and Nubbemeyer, E. (2017). Ghost Ads: Improving the Economics of Measuring Online Ad Effectiveness. Journal of Marketing Research 54(6). Working paper. Working paper (PDF)
- Vaver, J. and Koehler, J. (2011). Measuring Ad Effectiveness Using Geo Experiments. Google. Paper (PDF)
- Columbia Mailman School of Public Health. Difference-in-Difference Estimation. Page
- Abadie, A., Diamond, A. and Hainmueller, J. (2010). Synthetic Control Methods for Comparative Case Studies. Journal of the American Statistical Association 105(490). Paper (PDF)
- Google. CausalImpact documentation. Docs
- Meta. Robyn: An Analyst's Guide to MMM. Guide
- Card, D. and Krueger, A. (1994). Minimum Wages and Employment: A Case Study of the Fast Food Industry in New Jersey and Pennsylvania. American Economic Review; NBER Working Paper 4509 (1993). NBER
- Google. Understand your Conversion Lift based on users measurement data. Google Ads Help. Page
- UK Office for National Statistics. Percentages and percentage points. Service manual
- Lewis, R. and Rao, J. (2015). The Unfavorable Economics of Measuring the Returns to Advertising. Quarterly Journal of Economics 130(4). Paper
- Sellforte. Incrementality test holdout group size. Vendor blog; a rule of thumb, not a standard. Post
- Miller, E. Sample Size Calculator. Calculator
- Penn State Department of Statistics. STAT 507, Lesson 10: Power and Sample Size Considerations. Lesson
- ICH (1998). E9 guideline, statistical principles (Step 4, 5 February 1998). Guideline (PDF)
- Schulz, K., Altman, D. and Moher, D. (2010). CONSORT 2010 Statement. BMJ 340:c332. Article
- Miller, E. How Not To Run an A/B Test. Essay
- Google. Attribution and lift measurement. Google blog. Post