
What Does a Media Mix Model Separate, and What Can It Not Tell You?
Updated October 2026
A media mix model, also called marketing mix modeling, splits sales in two. One part is what you would sell anyway. The other is what each channel adds.
By MCP Analytics Team. Real data: none in this article. The pictures are illustrations, not data. For the same method on real data, see the business version below.
Also on this topic: the business version, on one brand's real weekly orders · the analyst version, on simulated data.
The answer first: what a media mix model separates
A media mix model, also called marketing mix modeling [1], splits sales in two. One part is what you would sell anyway. The other is what each channel adds. It allows for carryover and diminishing returns [1]. Our reading: that keeps a busy season from being credited to a channel. Analysts call carryover "adstock" [2]. Our plain-words equivalence: analysts also say "saturation" for diminishing returns. The sources say the method rests on what we see happen. So everything it reports is an association. It is not proof that a channel caused a sale [1]. This page covers what the model separates and why raw spend is not enough. It covers carryover, diminishing returns, the baseline and the traps. It ends with what our free tool does.
What this means for you
Use a media mix model to ask a first question. How much of my sales would I have had anyway? And what moves with each channel? Do not read its answer as proof of cause. Check whether the channels moved together before you read any one channel's share.
What a media mix model is, and what it separates
A media mix model looks at past sales and past marketing, week by week. It uses a kind of math called regression to see how they move together [1]. Sales are the thing we want to explain. Marketing is what we use to explain it [1]. The model splits sales in two. Base sales are the sales you would get with no marketing. Things like price, where the product is sold, long trends and the seasons drive them [1]. The rest are sales that marketing drives [1].
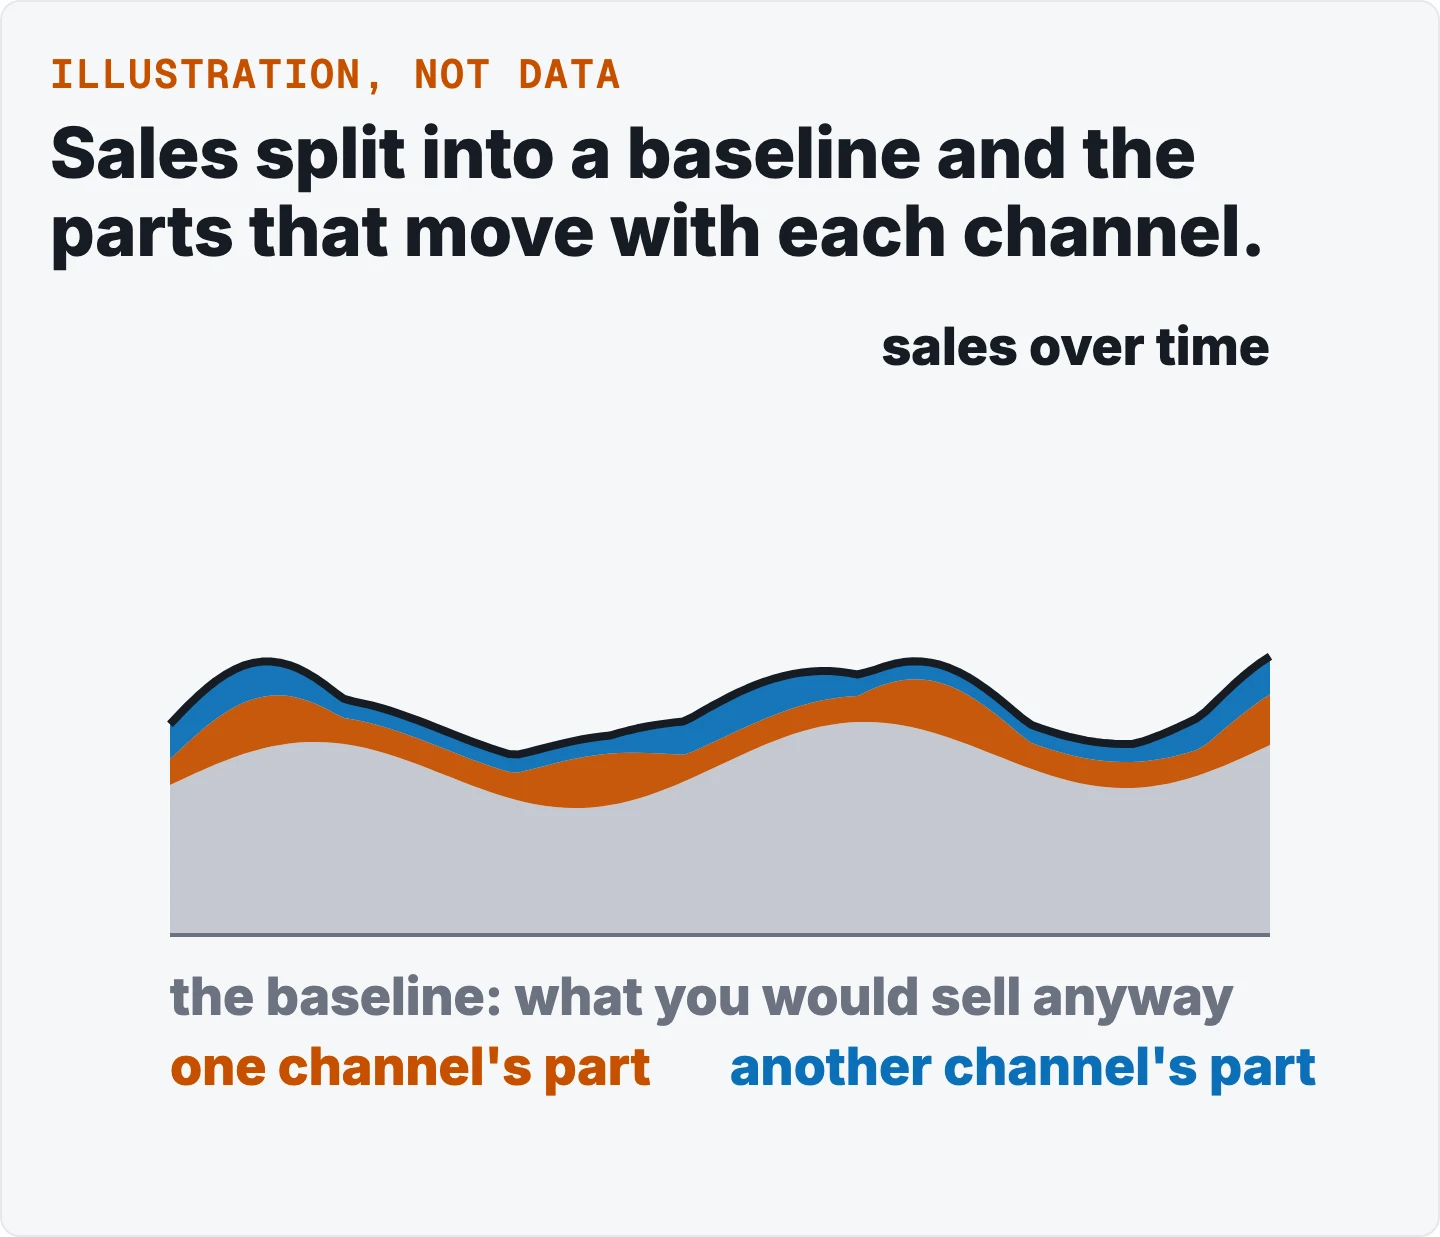
In plain words: the baseline is what you would sell anyway. What is left for the channels moves with marketing. Our reading: the goal is to see what each channel adds on top of that baseline.
Our illustration, not a sourced claim: stacked bands over time. A wide baseline band with a wave in it, and two thin channel bands on top.
Why raw spend is not enough
Our framing: if you just compare sales with raw spend, two things can go wrong. The first is that the effect lands only in the week the money is spent. The second is that the tenth dollar works as hard as the first. Also, with no baseline for trend and seasons, a channel can get credit for what the business would have done anyway. Three ideas fix this: carryover [2], diminishing returns [1] and the baseline [1]. The sentence that raw spend gets both wrong is ours.
Researchers at Google study the carryover and shape of ad effects. They say plain linear regression has a hard time with them, so they use a Bayesian method [3]. Our gloss: "shape" here means diminishing returns. The marketing mix modeling page says these models allow for delayed effects and effects that are not a straight line. They use a tool called adstock to do it [1].
Carryover
Adstock is a way to model how the response to an ad builds up and fades [2]. The term is credited to Simon Broadbent [2]. With no new ads, adstock fades to almost nothing [2]. The page's formula takes this week's ads and adds a fading share of last week's adstock [2]. Our name for that form is geometric: the same share fades each week.
In plain words: a burst of spend leaves a tail, and the tail fades. How fast it fades is something our tool fits from the data. You cannot look it up.
Diminishing returns
The marketing mix modeling page says these models allow for ads doing less over time [1]. Our plain-words reading: each extra dollar does less than the one before. The adstock page says saturation only starts above a certain level [2]. Our picture: the curve climbs and then flattens.
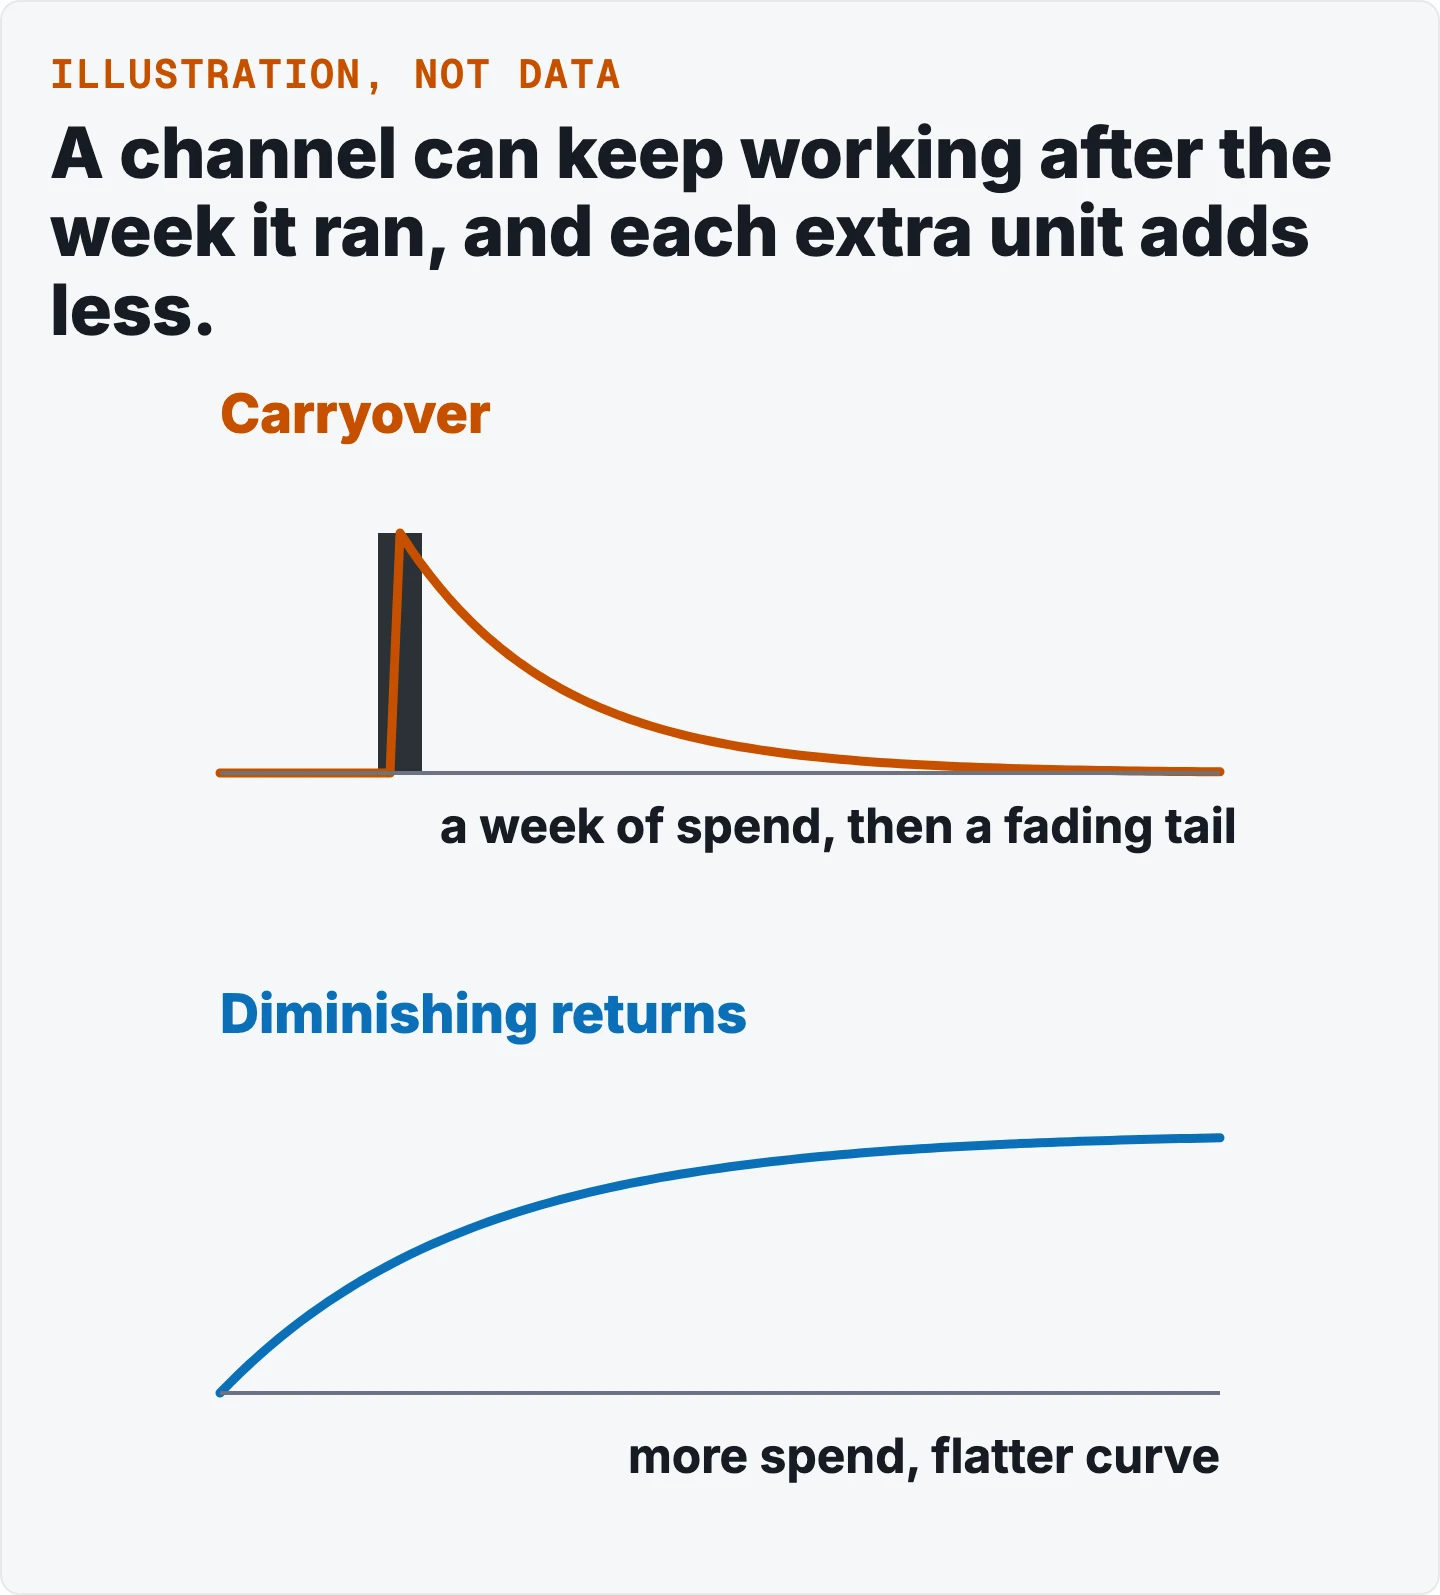
Where it flattens is a fit, not a fact. It depends on the data the model saw. Our reading: past the spend you actually tried, the curve is a shape the model assumed. It is not evidence.
Our illustration, not a sourced claim: one bump of spend with a fading tail. Next to it, a curve that climbs and then flattens.
The baseline
The baseline holds the sales you would have had with no marketing. The page lists trend and seasons among what drives it [1]. Our reading: that is why trend and seasons sit in the baseline and not in a channel. Leave them out, and a channel that was busy in the busy season gets credit for the season.
Traps
Channels that move together. The page gives a number called the variance inflation factor. It is one divided by one minus the R-squared you get when you predict one channel from the others [4]. A value of one means the channels are not linked. A higher value means the answer for that channel is less sure [4]. When channels are linked, they share ups and downs, and the model cannot credit that to one channel alone [4]. So the numbers can shift when another channel is added [4]. The page gives two rules of thumb from textbook authors [4]. Ours are different. They are in the tool section below.
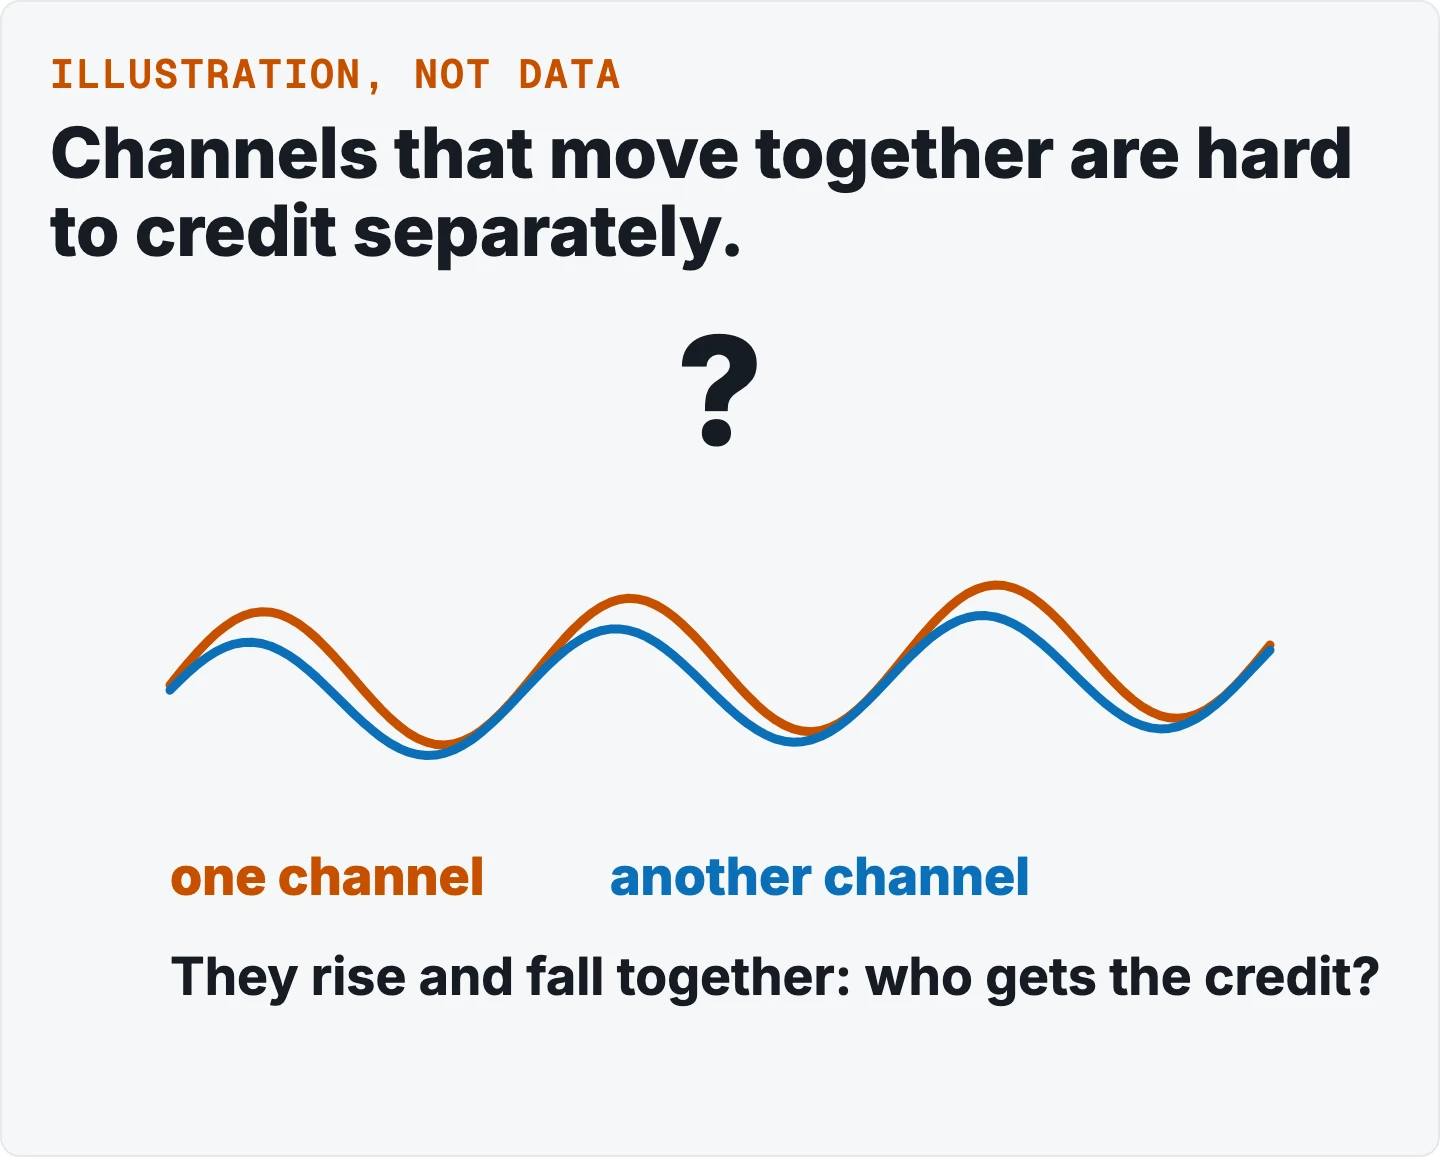
Our reading for media: if two budgets rise and fall together, the model can fit the total well. It can still split the credit wrongly.
Association is not cause. The marketing mix modeling page says the method rests on what we see happen, not on an experiment. It says the results can be thrown off by something left out, or by spend that moves together [1]. It also says these methods have given different answers than experiments [1]. A lift test is an experiment with a held-back group. It is the way to check a model's channel figures. The page describes three uses for experiments. They can set the model's starting guesses. They can check what the next dollar returns. They can set limits on channel effects [1].
A short history. The page says these models are a poor tool for new products, because a short history makes results unstable [1]. The Google abstract says the starting guesses matter a lot when there is little data. It also says the best mix can then vary a lot [3]. No source we read gives one minimum amount of data.
Short-term and media bias. The page says the method measures only short-term effects. It says brand equity is usually not captured [1]. It also says the method favors media that fit a time window [1]. It says effects can get lost when the data is too coarse. Its example is dealer ads, measured only at the national level [1].
The curve past the range. Our own remark: the model has seen only the spend levels that were bought. Past them, the curve is the model's shape. The data did not show it.
Our illustration, not a sourced claim: two channel lines rising and falling together. A question mark sits over who gets the credit.
What our free tool does
These are facts about our free media mix model, lite. They are ours. None comes from a source.
- It needs a date column, a number to explain, and at least one spend column. It works out the weekly or monthly rhythm from the dates. It says no to data that is too broken or too short. The least data it needs is its own rule, and it grows with the number of channels.
- Its baseline is a trend plus seasons, so the channels are not credited with the calendar. For daily data the seasons repeat weekly and yearly. For weekly or monthly data they repeat yearly.
- For carryover it uses the geometric form, with a fade fitted for each channel. For diminishing returns it uses a curve with a size fitted for each channel. Both are fitted. Neither is assumed.
- It searches for the best settings. It scores each try with a standard measure that rewards a good fit and punishes extra complexity. It holds back the last part of a long series and scores it on its own. That score is reported. It is not what picks the settings. The final model is ordinary least squares. It adds no shrinkage, on purpose, because shrinkage can make a tangled split look calmer than it is.
- For each channel it reports a contribution and a share. It reports a return per unit of spend and what the next unit returns. It reports the fade. It reports the spend level where the channel gets most of the way to its top. It also reports how far up its own curve the channel already sits.
- Its ranges come only from the regression. They leave out the doubt in the fitted fade and the flattening, so the true ranges are wider. The tool says so.
- It gives a verdict on how much channels move together: stable, fragile or unreliable. The cut-offs behind the verdicts are its own, not the sources'. It flags a channel whose spend never leaves one part of the curve, because then its size is hard to pin down. It reports a number called Durbin-Watson, because errors that follow each other make every range too narrow. It also warns that a high R-squared is easy to reach, because trend and seasons alone explain a lot.
- Past the spend it has seen, the curve is the model's shape assumption. It is not evidence.
- The blocks in the split add up to the fitted value. They do not add up to the real sales.
- It uses no experiment or lift test, and it does not claim cause. Its words say a channel "is associated with" a part of sales.
What it separates, and what it cannot
| The model can separate | The model cannot tell you |
|---|---|
| Sales you would have had anyway, from sales that move with marketing [1] | Whether a channel caused a sale [1] |
| A busy season from a busy channel, when trend and seasons sit in the baseline [1] | Who gets the credit when two channels move together [4] |
| Carryover, the tail a burst of spend leaves [2] | Brand effects that build over years, which are usually not captured [1] |
| Diminishing returns, where each extra dollar does less [1] | What happens past the spend levels you actually tried |
Our reading: the left column is what the model is for. The right column is why a lift test still matters.
A media mix model vs a lift test
Our reading: a media mix model works from the weeks you already have, so it can only show links [1]. A lift test holds back a group on purpose, so it can show what a channel added. The page we read describes using lift tests to check a model's marginal returns [1]. They work together; neither replaces the other.
How to check a media mix model on your own file
Our steps, from the traps above:
- Leave the last weeks out of the fit and see how the model does on them.
- Add up what the model gives the channels and the baseline, and compare with your sales.
- Look at whether channels moved together. If they did, do not read the split between them.
- For what one channel adds, run a lift test.
What you need and what you get back
What your file needs: a date column, a numeric outcome such as sales, and at least one spend column. These are our free tool's own requirements.
What you get back: a split of sales into baseline and channels. A return for each channel. A note on whether channels moved together. A check on weeks left out of the fit. The method is named, with the code that ran it. The tool says its ranges leave out some uncertainty.
How we checked
Every claim in this article is tagged to a numbered reference, and worded no stronger than that source. Our own readings are marked as ours. The tool facts come from reading the tool's code and settings. A second reader re-opened every link. The pictures are illustrations, not data.
Questions people ask
What is a media mix model?
A method that uses past sales and past marketing, week by week, to see how they relate [1]. It often uses regression.
Why not just regress sales on spend?
Raw spend misses carryover and diminishing returns, which the Google abstract calls hard to capture using linear regression [3]. Our reading: without a baseline it can also credit a channel with the calendar.
What are adstock and saturation?
Adstock is carryover: a model of how the response to advertising builds and decays [2]. Saturation is our plain-words name for diminishing returns, which the marketing mix modeling page describes as advertising's diminishing return over time [1].
What is the baseline?
The sales the business would have without marketing, driven by pricing, distribution, long-term trends and seasonality [1].
How do I know the split between channels is trustworthy?
Check whether channels move together. Correlated predictors share variance that cannot be uniquely credited to one of them [4]. Our free tool gives a collinearity verdict for this.
Can a media mix model prove a channel caused sales?
No. The page describes it as resting on observational correlation and as sensitive to omitted variables and correlated spend [1]. A lift test is the way to check.
How much data is enough?
No source we read gives a universal minimum. The Google abstract says priors have a big impact when the sample size is small [3]. Our free tool has its own minimum.
How do experiments fit in?
The page describes aligning parameters with experiments by defining priors, checking marginal returns against lift tests and constraining elasticities [1].
Sources
- Wikipedia. Marketing mix modeling. Used for definitions and listed limits only; the page's own label "causal inference" is not repeated here. Page
- Wikipedia. Advertising adstock. Page
- Jin et al. Bayesian methods for media mix modeling with carryover and shape effects. Google Research. The abstract page. Page
- Wikipedia. Variance inflation factor. Page