
How long does a subscription account actually last?
Your billing export can answer that two ways, and they differ by nearly half. One of the answers is wrong every time, and always in the same direction.
What is survival analysis?
Survival analysis is the branch of statistics for measuring how long until something happens, when for some of the things you are measuring it has not happened yet. It was built in medicine, where the event was death and the awkward fact was that patients were still alive when the study ended. The same shape turns up everywhere, so the same method has several names: engineers call it reliability analysis, economists call it duration analysis, sociologists call it event history analysis. It is all one method wearing different jackets.
It answers three questions that ordinary averages cannot:
- What share of a population is still going after a given amount of time?
- Among those still going, at what rate do they drop out?
- Does some characteristic make dropping out more or less likely, and by how much?
The thing that makes it a distinct method rather than an average with extra steps is censoring: you know something about a subject's duration but not the whole of it. A customer who is still subscribed today has not given you a final number, but they have told you something exact, which is that their subscription lasted at least this long. That is information, not a gap. Ordinary statistics has no way to use a "at least this much" observation. Survival analysis is what does.
The business version of the problem is the one below. A churn rate tells you that some share of customers left this month; it never tells you whether they left after three weeks or three years, and those are different companies with different economics. Survival analysis is how you get from a rate to a lifetime.
The mistake in the obvious approach
Somebody asks how long a customer stays. You export your accounts, take the ones that have churned, work out how long each one lasted, and average it. That number is easy to get and it feels like the answer.
It is not the answer, and the reason is sitting in the rows you skipped. An account that is still paying you today has no end date. It falls out of the average automatically. And those are, by definition, your longest-lived accounts. You have quietly deleted the good news and reported what was left.
The two answers, on real numbers
Everything below runs on one dataset: 320 business accounts, each with a start date, an end date where there is one, and whether onboarding was ever completed. Of those, 210 have churned and 110 are still running. That is 34% of the book with no end date, which is a completely ordinary share for a business that is still growing.
Average only the 210 that ended and you get a median of 301 days. Count every account for exactly as long as you actually watched it, and the median is 540 days, with a 95% confidence interval from 451 to 637. The first number is 44% short.
The error has a direction, and that is what makes it dangerous rather than merely noisy. A still-running account's duration is a lower bound: this one lasted at least this long. Dropping lower bounds can only pull an estimate down. So the naive number is not sometimes high and sometimes low. It is always short, and it gets shorter the healthier your retention is.
What counting properly looks like
The method is Kaplan-Meier. It walks forward through time, and at each moment an account churns it asks a narrow question: of the accounts still being watched right now, what share survived this step? Multiply those together and you have a curve. Every account contributes for exactly as long as it was observed and then stops contributing, which is how a still-running account can count without anyone pretending to know its end date.
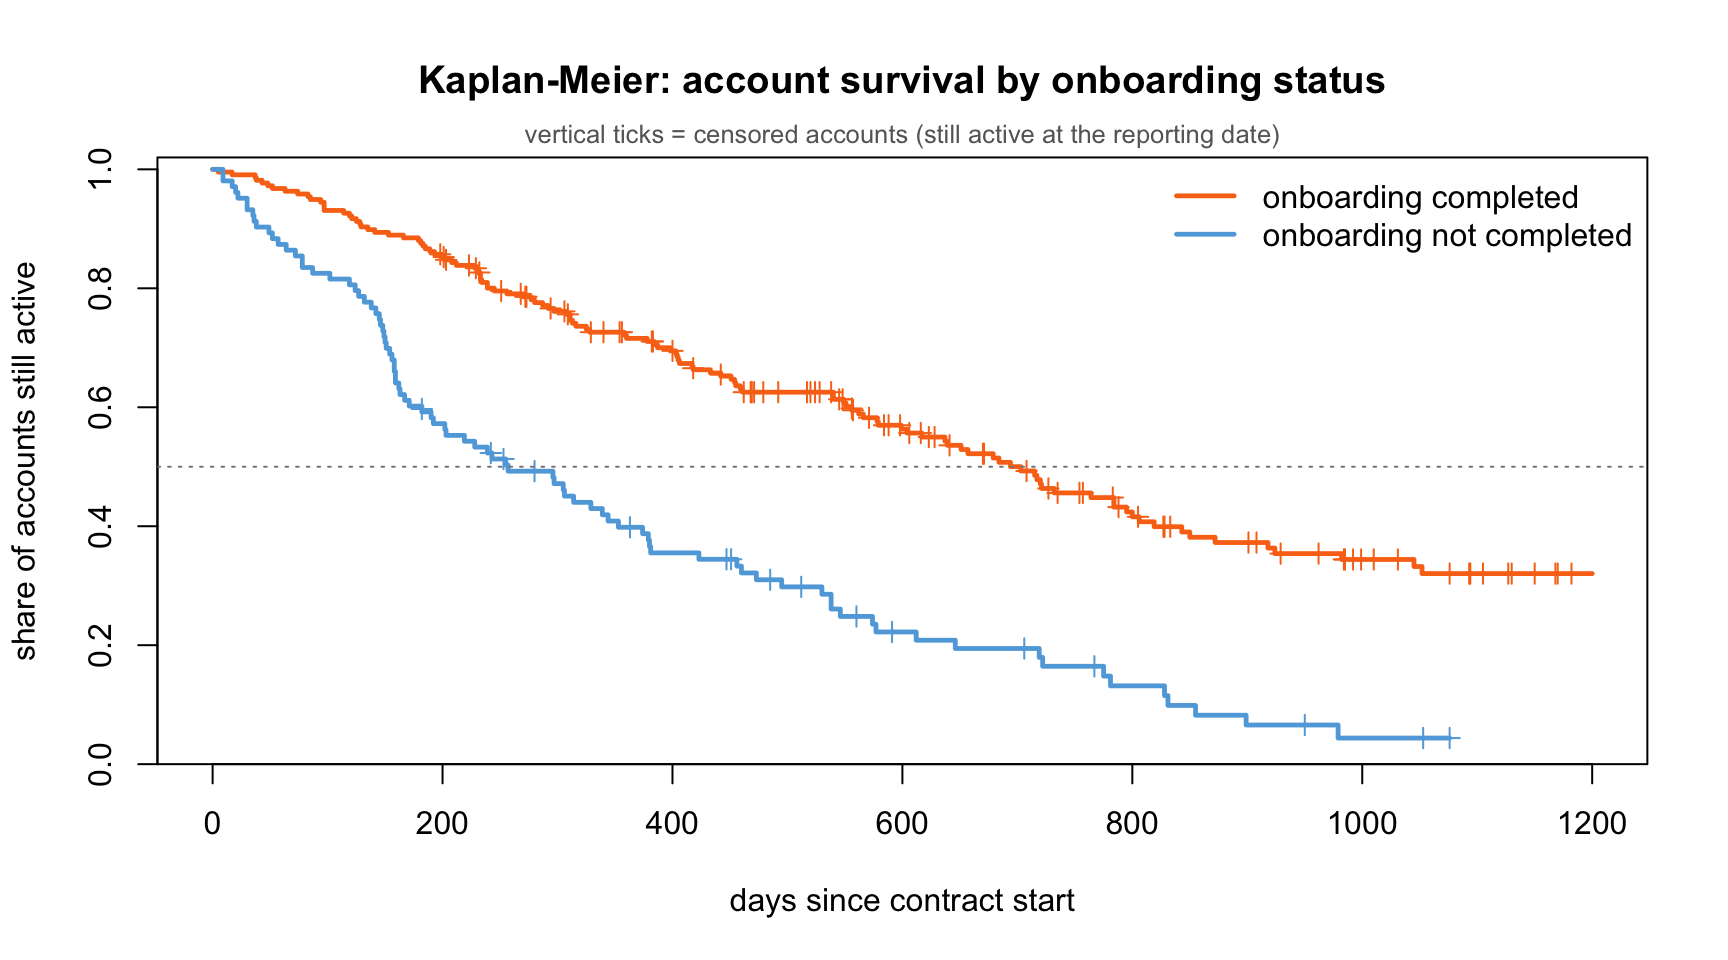
Read the whole book off that curve and you get the numbers a plan can use: about 61% of accounts are still there after one year, 37% after two, 23% after three.
| Anchor | Still active | 95% CI |
|---|---|---|
| 1 year | 0.6137 | 0.5618 – 0.6703 |
| 2 years | 0.3671 | 0.3125 – 0.4313 |
| 3 years | 0.2305 | 0.1788 – 0.2973 |
If you need an average rather than a median, use the restricted mean and state the window out loud: over a 730-day horizon it is 470.03 days. A mean lifetime is not a well-defined quantity without a horizon, which is exactly why that number carries one.
The finding the single average was hiding
A number for the whole book is a summary of things that may not resemble each other. Split these accounts by one column, whether onboarding was ever completed, and one business turns into two.
| Group | Accounts | Median lifetime | 95% CI |
|---|---|---|---|
| Onboarding completed | 217 | 703 days | 599 – 800 |
| Not completed | 103 | 257 days | 190 – 374 |
Roughly 2.7 times the median lifetime. The log-rank test, which compares the entire curves rather than one point on them, puts the chance of a split this clean arising from luck at about two in a trillion. The hazard ratio says an account that skipped onboarding carries about 2.66 times the risk of leaving at any given moment, with an interval from 2.00 to 3.52 that sits well clear of 1.
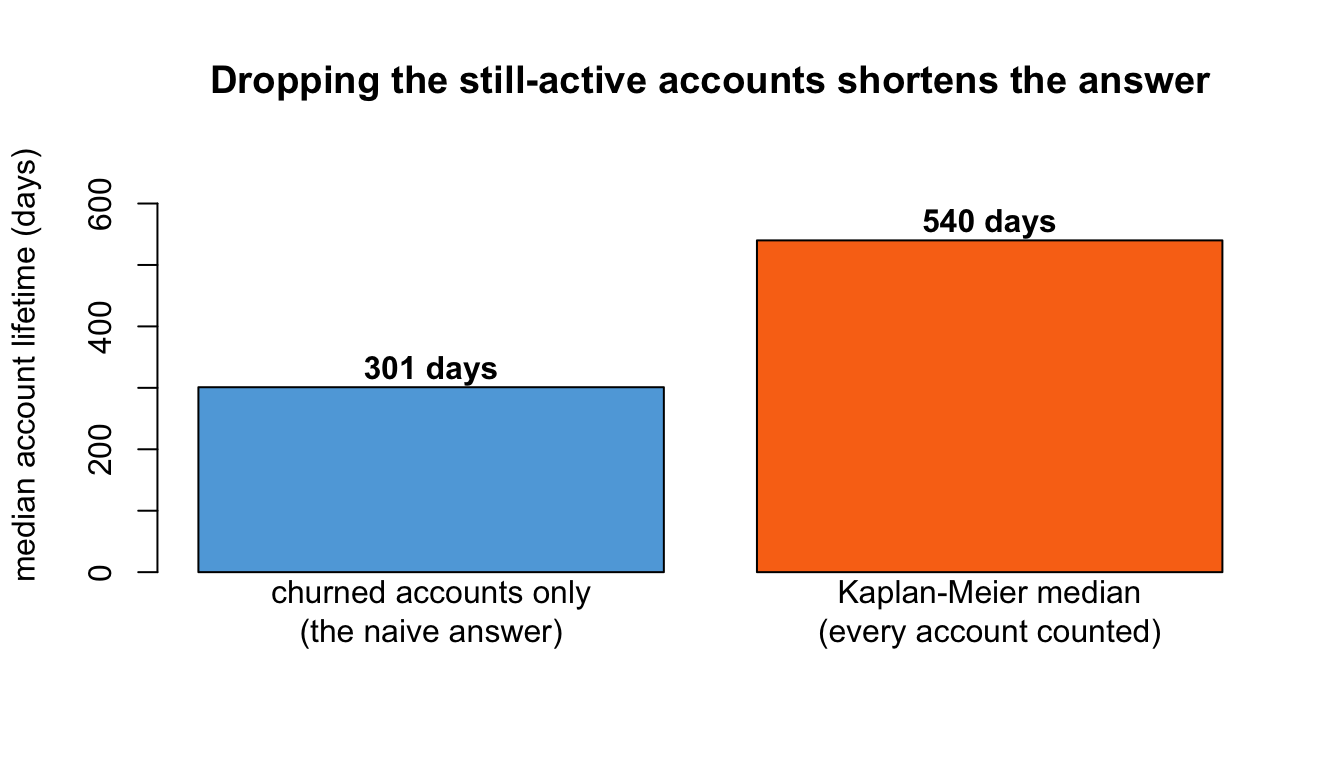
That is a different kind of finding from "our median is 540 days". It names something you can act on this quarter, and it was invisible while the book was reported as one number.
What the analysis needs from your file
Three columns. Two of them you probably have to make first, and that is the step most people miss.
| account_id | onboarding | started_at | churned_at | tenure_days | churned |
|---|---|---|---|---|---|
| ACC-0001 | completed | 2023-07-03 | NA | 1093 | 0 |
| ACC-0002 | completed | 2024-10-15 | 2026-01-13 | 455 | 1 |
| ACC-0003 | not_completed | 2023-12-08 | 2024-06-28 | 203 | 1 |
Those are real rows from the file below, not a mock-up. The first one is the one that teaches: no churn date, because that account is still running. It is marked 0, and its 1,093 days still count.
- How long you watched each account, as a number rather than a date. For a
churned account that is the end date minus the start date. For one still running it is today
minus the start date. Notice that
tenure_daysis derived from the two date columns, not exported alongside them. If your file has dates and no duration, there is nothing for the analysis to read. - Whether it ended. A 1 for churned, a 0 for still running. Both stay in the file.
- Something to compare. Plan, channel, region, whether onboarding finished. If you do not want a comparison, put the same value in every row and you get one overall curve.
The mistake worth naming. Deleting the rows with a blank end date. It feels like tidying up missing data. It is the one move that guarantees a wrong answer, and avoiding it is the entire reason this analysis exists.
Every number here, you can re-run
This page is not a screenshot of an analysis. It is an analysis. The document below derives every figure when it runs, and it was checked three ways: by the document itself, by R's standard survival functions called directly, and by a Python rewrite of Kaplan-Meier, the log-rank test and Cox regression built from scratch rather than imported from a library. All three agree to every digit shown.
That last part is deliberate. A second library agreeing with the first mostly proves they share an author's assumptions. An independent reimplementation agreeing is a stronger claim, and it is the one we wanted to be able to make.
Read the full knitted analysis, the document itself with every chart, table and line of code as it ran. Or take the source and the data below and run it yourself.
The limits, stated plainly
The 44% gap compares medians, 301 days against 540. It is not a claim about means, and we deliberately do not publish a mean lifetime for the whole book, because a mean is not identifiable without a stated horizon.
Two things this method cannot tell you, and neither announces itself in the output. If accounts disappear from your data precisely because they were about to churn, the censoring is informative and the estimate is biased; nothing here detects that, it has to be reasoned about. And if two groups' curves cross, a single hazard ratio stops meaning anything while still returning a number, which is why the curves are worth looking at rather than just the summary.
The dataset is fixed and reproducible: the notebook regenerates it from its seed, so every figure on this page can be re-derived exactly rather than taken on trust.
Why this matters to the business
three 60-second cuts · scroll for more →
Download
Two files. The notebook regenerates the dataset from its seed, so re-knitting reproduces this page's figures exactly.
- survival.Rmd · the analysis, R Markdown source9 KB
- survival_accounts.csv · the 320 accounts22 KB
Both files are released under CC BY 4.0: use them anywhere, including commercially, with attribution.
Run this on your own accounts
Upload a CSV with a duration, an event flag and a group, and get the curve, the medians with confidence intervals, the log-rank test and the hazard ratios back. Free, and no account needed.
your file is deleted after seven days · PDF and citation includedThe brief for an AI agent
If an AI assistant is choosing a method for you, it needs different things than you do: the discriminating condition, the questions this gets mistaken for, the failure modes that return a plausible number instead of an error, and figures it can cite rather than generate. We publish that as its own document, written to one bar: an agent asked whether to run this analysis should be able to answer from it alone, including saying no.
Read the agent briefYour turn
Bring your own data and the question you actually need answered.
CympleData Scientist Send me your data and question, I’ll send you the analytics. ds@mcpanalytics.ai