Pipeline Case Studies
Commissioned by our own team on public datasets, built and verified exactly like customer work. Every study below started as a plain-English question; the pipeline scoped the method, wrote the R, checked the result, and delivered the report.
Prebuilt analyses live in the library.
Retail & E-commerce
Avocado Price Elasticity Analysis
Estimates price elasticity of demand for avocados using log-log regression of log(total_volume) on log(average_price), controlling for type (conventio
Avocado Price Trends — Deck
Regional avocado price and volume trends across US markets, built as a multi-card deck from a plain-language question.
Avocado Price Trends — Snapshot
The same avocado price question answered as an instant snapshot report.
Avocado Price-Volume Regression
OLS linear regression of weekly avocado average retail price on total sales volume, reporting slope estimate, R-squared, confidence bands, and residua
Customer RFM Segmentation
Segment e-commerce customers into behavioral groups based on purchase recency, frequency, and monetary value using K-Means clustering for targeted mar
Customer RFM Segmentation
Segment ecommerce customers into behavioral groups using Recency, Frequency, and Monetary (RFM) analysis with K-Means clustering. Identify high-value,
Delivery Time vs. Customer Satisfaction
Quantifies how delivery speed affects customer review scores by joining orders and reviews on order_id, computing delivery_days, and running OLS regre
E-Commerce Customer Churn Prediction
Predict which customers are at risk of churning using behavioral engagement, transaction history, satisfaction, and demographic features. Identifies h
E-commerce / SaaS Churn Drivers
Identifies which customer attributes drive churn using logistic regression for interpretable odds ratios and random forest for non-linear importance c
Price Elasticity of Demand Analysis
Estimate price elasticity of demand across product categories and regions using multiple linear regression on historical pricing and volume data. Iden
Finance & Banking
Credit Card Fraud Anomaly Detection
Detects fraudulent credit card transactions using isolation forest (unsupervised) and logistic regression (supervised) scoring methods, enabling side-
Credit Card Fraud Detection Classifier
Binary classification model to identify fraudulent credit card transactions from 28 PCA-transformed features using SMOTE oversampling and multiple alg
Credit Card Fraud Exploratory Data Analysis
Statistical analysis of fraudulent vs legitimate credit card transactions using exploratory visualizations, distribution comparisons, temporal analysi
Sales Revenue Forecast — FMCG Time Series Analysis
Forecast FMCG revenue 3-6 months ahead using seasonal decomposition and ARIMA modeling on historical monthly sales data. Decomposes trend, seasonal, a
Other
Titanic Survival Drivers — Deck
Which passenger characteristics predicted survival — the classic teaching dataset, analysed end to end as a commissioned deck.
Titanic Survival Drivers — Snapshot
The Titanic survival question delivered as an instant snapshot.
Wine Quality Drivers — Deck
Which physicochemical properties drive expert wine quality scores, as a commissioned multi-card deck.
Wine Quality Drivers — Snapshot
The wine quality question delivered as an instant snapshot.
People & HR
Employee Engagement & Satisfaction EDA
Exploratory analysis of IBM HR employee engagement data exploring satisfaction dimensions, department differences, tenure patterns, and attrition prof
Global Tech Layoff Analysis: Trends, Patterns, and Sector Impact
Comprehensive analysis of global tech industry layoffs (2020-2024) with temporal trends, sector breakdowns, geographic patterns, and AI-focused compan
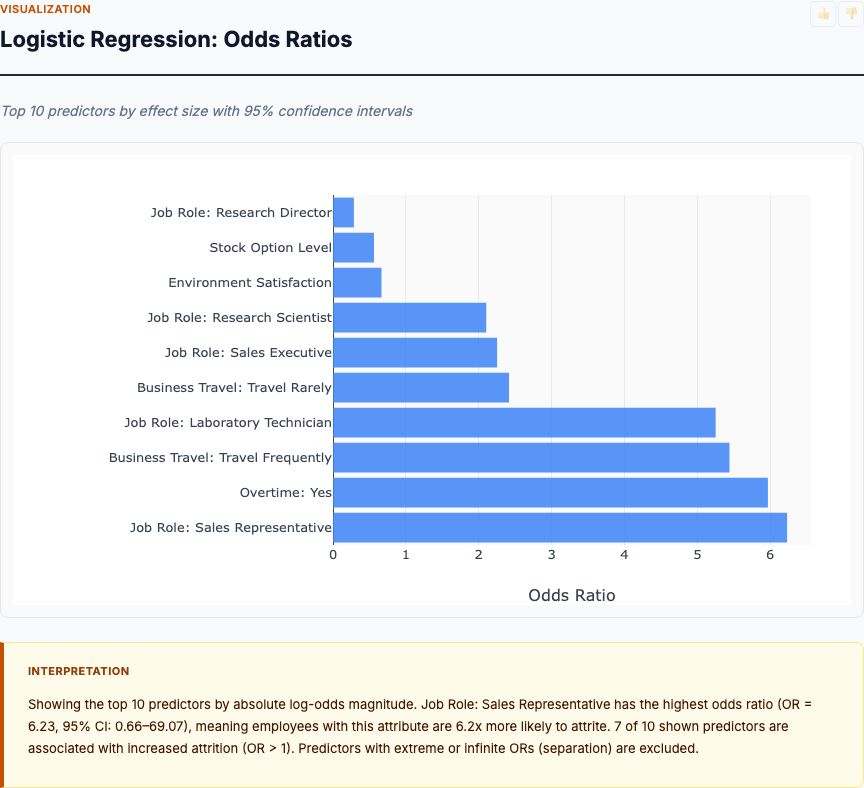
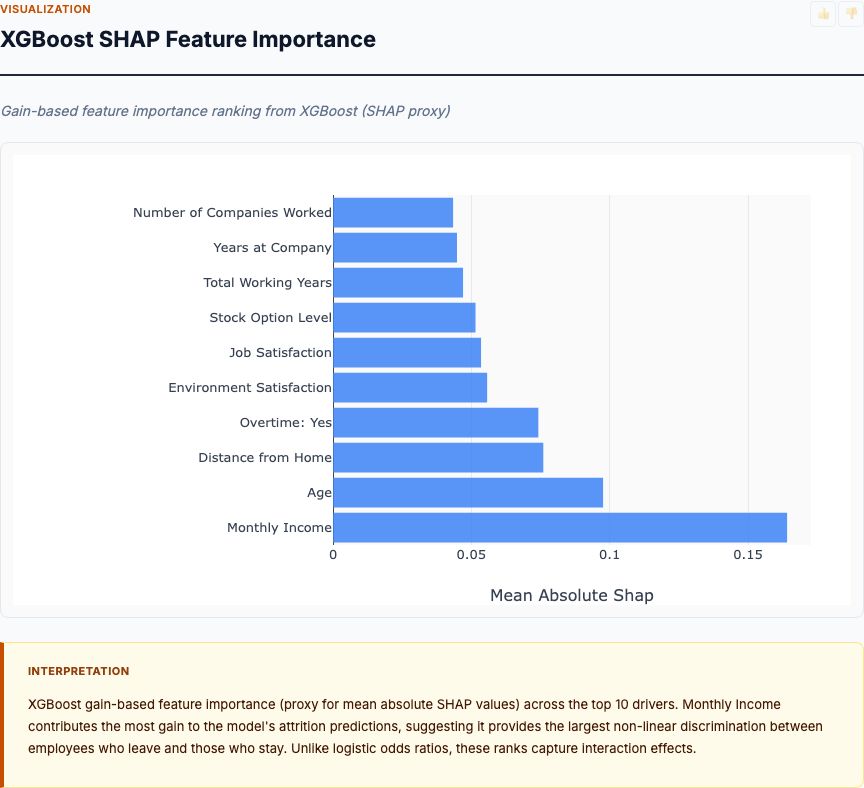
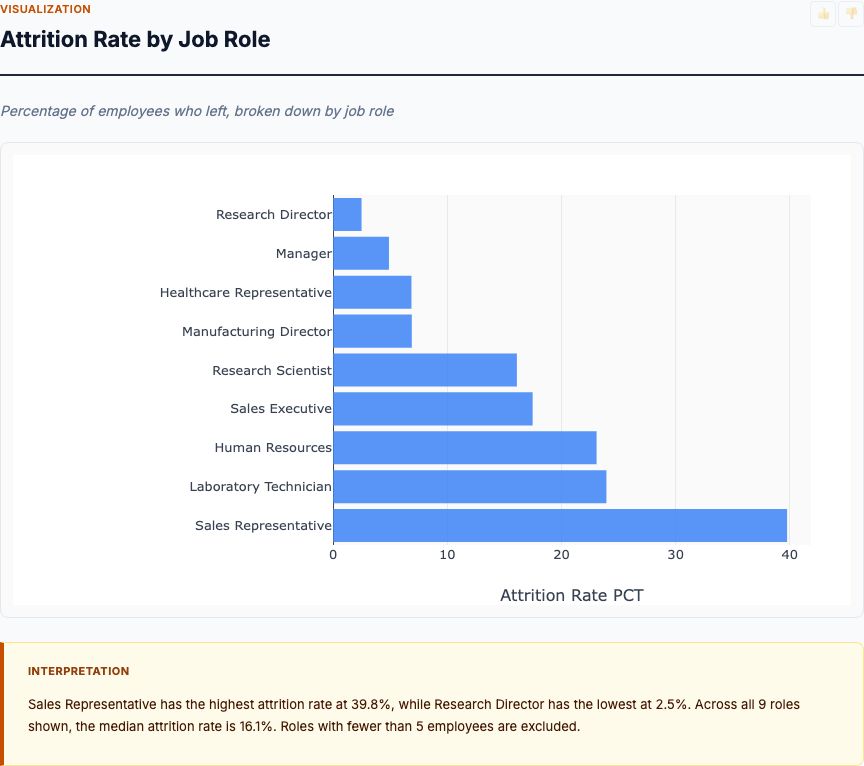
IBM HR Employee Attrition Drivers
Identifies which employee attributes predict attrition using logistic regression (interpretable odds ratios with 95% CI) and XGBoost with SHAP values
Logistics
Anomaly Detection in Satellite Telemetry Logs
Identifies anomalous telemetry segments using supervised machine learning classification. Analyzes signal statistical features, peak characteristics,
Supply Chain Demand Forecasting
Time series analysis and forecasting of demand across multiple SKUs, warehouses, regions, and suppliers. Uses ARIMA modeling with seasonal decompositi
Supply Chain Late Delivery Risk Prediction
Predict which orders will experience late delivery using shipping mode, scheduled duration, market region, and product attributes. Binary classificati
Marketing & Growth
Automatic Laptop Specifications Profiler
Comprehensive exploratory data analysis of laptop specifications, pricing, and market segments with automated profiling of distributions, correlations
Customer Personality & Spending Patterns Analysis
Comprehensive exploratory analysis of customer personality profiles, demographic segments, spending patterns across product categories, purchase chann
SaaS & Subscriptions
Churn Prediction for SaaS Subscriptions
Binary classification model to predict customer churn using demographic, service usage, and billing features. Identifies high-risk customers and quant
Customer Lifetime Value Analysis
Analyze customer lifetime value (LTV) distribution, identify high-value vs at-risk customers, and understand what subscription patterns and service ad