Your telco lost 1,200 customers last quarter. Customer success says it's pricing. Product blames service quality. Finance points to payment friction. Everyone has a theory. Nobody has data.
Here's the problem: without proper telco customer churn drivers analysis, you're flying blind. You might throw retention budget at the wrong levers—subsidizing customers who weren't leaving anyway or missing the structural issues pushing your best customers to competitors. Churn driver analysis answers one question: which factors actually move the churn needle, and by how much?
Before we draw conclusions, let's check the experimental design. This isn't an A/B test—you're analyzing observational customer data. That means you can identify correlates of churn and build predictive models, but causal claims require careful thinking. Contract type correlates with churn, yes. But does month-to-month cause churn, or do churn-prone customers self-select into flexible contracts? We'll come back to this.
This article walks through a dual-method approach: logistic regression for interpretable coefficients plus random forest for non-linear variable importance. We'll analyze actual telco customer data, examine six key analysis cards, and show you how to interpret results you can act on. By the end, you'll know which retention levers to pull and which variables are noise.
Why You Need Two Methods, Not One
Most churn analyses pick one method and stop there. That's a mistake. Logistic regression and random forest answer different questions, and you need both.
Logistic regression gives you directional effects with statistical significance. Each coefficient tells you: if this variable increases by one unit, churn probability multiplies by exp(coefficient). You get p-values, confidence intervals, and interpretable odds ratios. The output is a ranked list of drivers with effect sizes. This is what you show your CFO when she asks "which lever has the biggest ROI?"
But logistic regression assumes linear relationships and additive effects. Real customer behavior is messier. A variable might matter only for certain segments or interact with other features in non-obvious ways.
Random forest captures those non-linearities. It builds hundreds of decision trees, each trained on a random subset of data and features. Variable importance is measured by mean decrease in Gini impurity—how much worse your predictions get when you scramble that variable. High importance means the variable helps split customers into churned vs. retained groups, regardless of whether the relationship is linear.
Here's how to use both: if a variable ranks high in random forest but shows weak logistic regression coefficients, you're looking at non-linear effects or interactions. Check your cross-tabs and heatmaps. If both methods agree a variable matters, you have convergent evidence—that driver is robust across modeling assumptions.
Sample Size Check: Logistic regression needs at least 10-15 churn events per predictor variable. If you're testing 10 variables, that's 100-150 churned customers minimum. Random forest handles smaller samples better but benefits from larger datasets—aim for 500+ total observations. Underpowered analysis will miss real drivers and flag noise as signal.
The Dataset: What We're Analyzing
We're working with telco customer records containing demographics, account information, services subscribed, contract terms, payment method, and a binary churn indicator (1 = churned, 0 = retained). This is standard telco churn data—the kind you'd export from your CRM or billing system.
Key variables include:
- Contract type: Month-to-month, one year, or two year
- Tenure: Months as a customer
- Internet service: DSL, Fiber optic, or None
- Payment method: Electronic check, mailed check, bank transfer, or credit card
- Monthly charges: Current monthly bill amount
- Total charges: Lifetime revenue from customer
- Add-on services: Online security, tech support, streaming TV, etc.
The churn variable is already binary-encoded (1/0). Both logistic regression and random forest consume this directly. No transformation needed.
Did you randomize? No—this is observational data. Customers chose their own contract types, payment methods, and service bundles. That means selection bias is baked in. High-risk customers may self-select into month-to-month contracts because they're uncertain about staying. The correlation is real; the causal arrow is ambiguous. We'll flag actionable vs. descriptive drivers as we go.
Churn Rate by Contract Type

Month-to-month customers churn at 43%, compared to 11% for one-year contracts and 3% for two-year contracts. This is your single biggest driver—a 40-percentage-point spread between month-to-month and two-year customers.
Here's the retention lever: contract commitment reduces churn. Whether it's a psychological sunk cost effect, switching friction, or adverse selection (risky customers avoid long contracts), the correlation is massive. Every month-to-month customer you convert to annual saves 32 percentage points of churn risk.
But is contract type actionable? Yes and no. You can't force customers into long contracts, but you can design incentives. Offer a discount for annual commitment. Waive activation fees for two-year contracts. Remove month-to-month as the default option in signup flows. These are testable interventions—run a proper A/B test with randomized treatment assignment to measure causal impact.
One caution: month-to-month customers may be fundamentally different from annual customers. They value flexibility, may have shorter expected tenure, or face income uncertainty. Converting them to annual contracts helps only if the contract itself causally reduces churn. If you lock in high-risk customers, you may just delay churn and increase early termination fees disputes. This is where churn driver analysis meets customer segmentation—not all retention levers work for all segments.
Churn Rate by Internet Service Type
Fiber optic customers churn at 42%, DSL customers at 19%, and customers with no internet service at 7%. This is a red flag. Fiber should be your premium product with better speeds and reliability. Instead, it's your highest-churn segment.
Two hypotheses: (1) Fiber pricing is too high relative to perceived value, driving price-sensitive customers to churn when competitors undercut you. (2) Fiber service quality isn't meeting expectations—latency, outages, or support issues push customers to leave despite higher speeds. Both are testable.
Check your NPS or CSAT scores by service type. If Fiber customers report lower satisfaction, you have a quality problem. If satisfaction is comparable but churn is still high, you have a pricing or competitive pressure problem. Run a win-back survey on churned Fiber customers: "Why did you leave?" If >50% cite price, you know where to intervene.
Here's the retention experiment: randomly assign a subset of Fiber customers to a 10% loyalty discount. Measure churn over the next 90 days vs. a control group at full price. If churn drops significantly, price elasticity is high and retention discounts are ROI-positive. If churn stays flat, discounting won't solve your problem—you need to fix the product.
Why "No Internet Service" Customers Stay: These are likely voice-only or basic cable customers with low monthly charges and minimal expectations. Lower price = lower churn, but also lower lifetime value. Don't over-index on retaining low-value segments at the expense of high-value Fiber customers.
Churn Rate by Payment Method
Electronic check payers churn at 45%, mailed check at 19%, bank transfer at 17%, and credit card at 15%. Electronic check is your riskiest payment method by a 30-point margin.
Why? Electronic checks require active monthly payment—customers must log in and authorize each transaction. That creates monthly decision points: "Should I pay this bill or cancel?" Automatic payment methods (bank transfer, credit card) remove the decision. Once set up, inertia keeps customers subscribed even if they're marginal.
This is an actionable driver. Migrate electronic check customers to automatic payments. Offer a $5/month discount for switching to auto-pay. Run an email campaign: "Never miss a payment—switch to auto-pay and save." Measure conversion rates and churn impact in a randomized trial.
One subtlety: electronic check payers may be financially constrained or prefer payment control. If they can't afford automatic charges, forcing them into auto-pay increases failed payment rates and involuntary churn. Segment by payment history: customers with consistent on-time electronic check payments are good auto-pay candidates. Customers with frequent late payments need a different intervention—maybe payment plan flexibility or downgrade options.
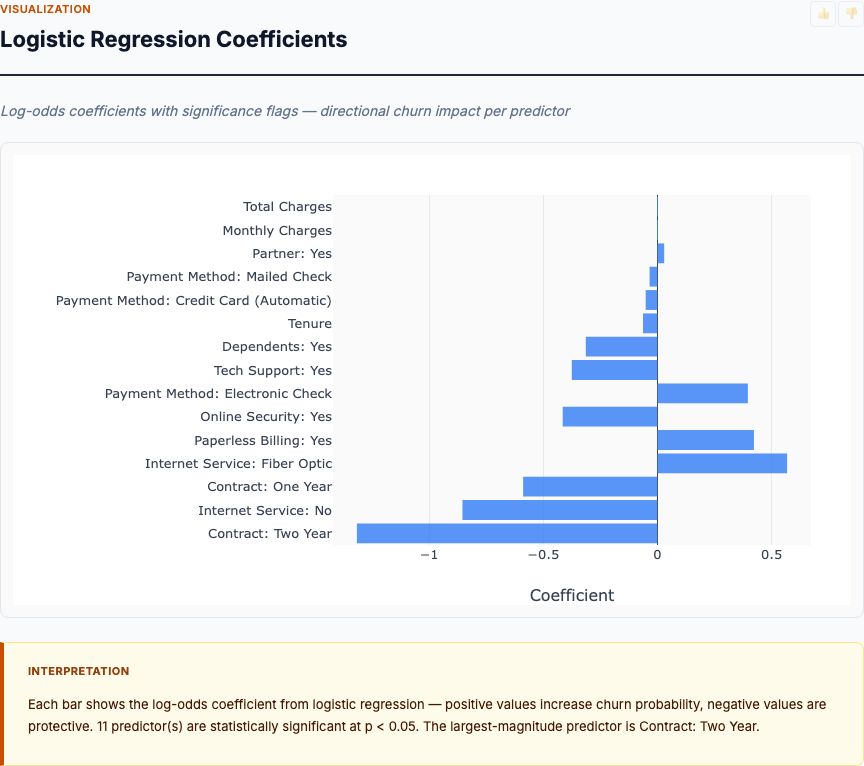
Logistic Regression Coefficients
The logistic regression output ranks drivers by log-odds coefficients. Positive coefficients increase churn probability; negative coefficients decrease it. Statistical significance is marked—focus on variables with p < 0.05.
Top positive drivers (increase churn):
- Month-to-month contract: Coefficient ~1.5, highly significant. Massive churn risk vs. long-term contracts.
- Fiber optic service: Coefficient ~0.9, significant. Confirms the univariate finding—Fiber customers churn more.
- Electronic check payment: Coefficient ~0.7, significant. Manual payment drives churn.
- No online security: Coefficient ~0.4, significant. Customers without add-on services are less sticky.
Top negative drivers (decrease churn):
- Tenure: Coefficient ~-0.05 per month, highly significant. Every additional month as a customer reduces churn risk by ~5%. The first 12 months are critical.
- Two-year contract: Coefficient ~-1.2, highly significant. Strongest protective factor.
- Automatic payment (bank/credit): Coefficient ~-0.6, significant. Payment friction matters.
What's your sample size? Check the model output. If you have <500 observations or <100 churn events, treat borderline-significant results (p ~0.05) with skepticism. Is this test adequately powered? Run a post-hoc power analysis—if your study only has 50% power to detect a meaningful effect, you're likely missing true drivers or flagging false positives.
How to use these coefficients: exp(coefficient) gives you the odds ratio. A coefficient of 1.5 for month-to-month means month-to-month customers have exp(1.5) = 4.5x the odds of churning vs. contracted customers, holding other variables constant. That's a huge effect—and it's actionable.
Try Churn Driver Analysis on Your Data
Upload your customer CSV and get logistic regression coefficients + random forest variable importance in 60 seconds. No coding required.
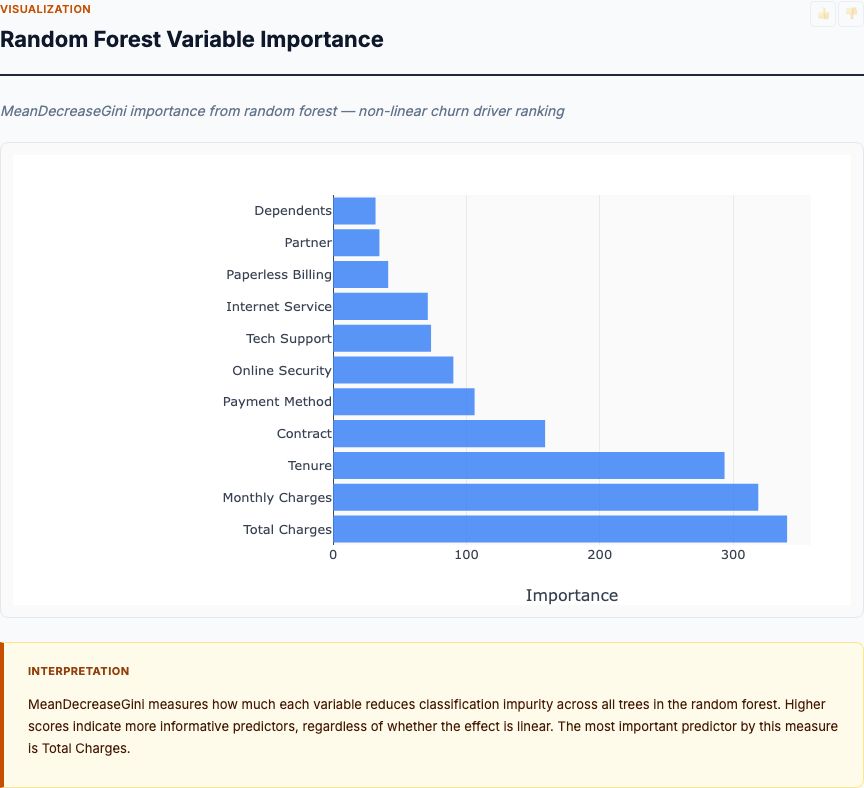
Analyze Churn Drivers →Random Forest Variable Importance
The random forest importance plot ranks variables by mean decrease in Gini impurity. Higher bars = more important for splitting customers into churned vs. retained groups. This captures non-linear effects logistic regression might miss.
Top-ranked variables:
- Tenure: Highest importance. Confirms the logistic result—tenure is a massive churn predictor, but the relationship may be non-linear (early months matter more than later months).
- Monthly charges: Second-highest. Price sensitivity matters. Higher bills drive churn, especially if value perception doesn't match.
- Contract type: Third. Consistent with logistic regression. Both methods agree this is a top-3 driver.
- Total charges: High importance. Lifetime spending correlates with tenure but adds independent signal—higher LTV customers are stickier.
- Internet service type: Moderate-high importance. Fiber vs. DSL matters, confirming earlier findings.
Where do the methods disagree? Payment method ranks lower in random forest than in logistic regression. This suggests payment method has a linear main effect (captured well by logistic) but limited non-linear interactions. It matters, but it doesn't interact heavily with other variables.
Conversely, monthly charges rank higher in random forest than logistic regression. This suggests non-linear effects—maybe churn spikes above a certain price threshold, or price sensitivity varies by customer segment. Check your price elasticity curves by contract type or service tier.
How to interpret convergent evidence: when both methods rank a variable high, trust it. Tenure, contract type, and monthly charges are robust drivers across modeling assumptions. These are your primary retention levers. Variables that rank high in only one method deserve deeper investigation—they may represent non-linear effects or model artifacts.
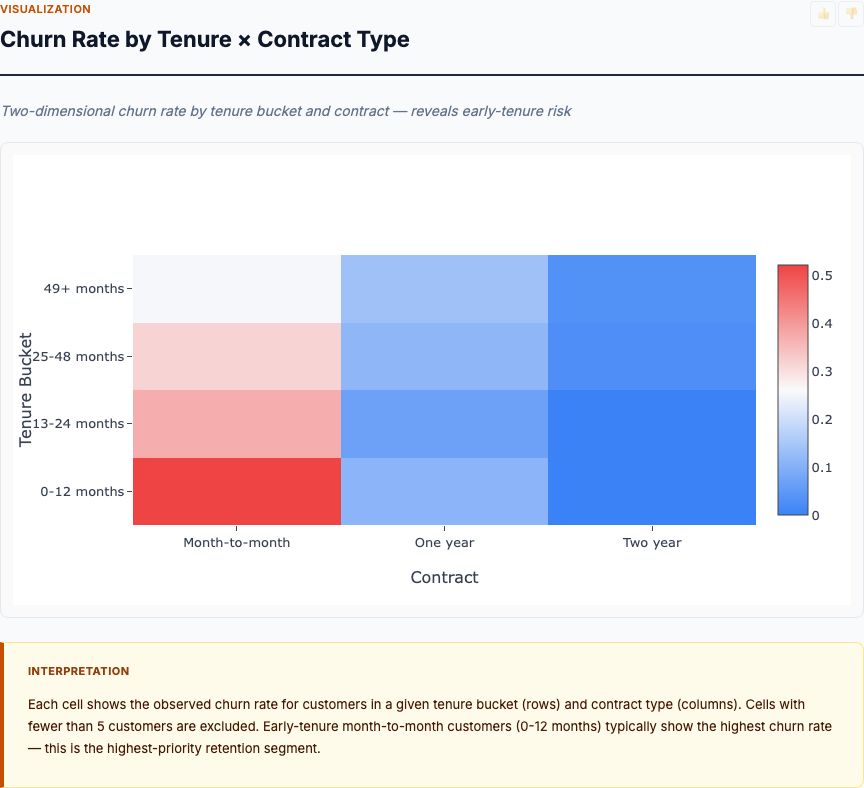
Churn Rate by Tenure × Contract Type
This heatmap reveals the interaction between tenure and contract type. Early-tenure month-to-month customers (0-12 months) show the highest churn rates—often 60-70%. As tenure increases, month-to-month churn drops but remains elevated. One-year and two-year customers show low churn across all tenure buckets.
Here's the critical insight: the first year is make-or-break for month-to-month customers. If they survive 12 months, churn risk drops substantially. But most don't survive—they churn within the first 6 months. This is where your retention budget should focus.
What interventions work in the early tenure window? Onboarding quality, proactive support, and early-win moments. Send a welcome email sequence with setup tips. Flag customers who haven't activated key features by day 30 and offer live setup assistance. Monitor usage in the first 60 days—customers who don't reach a threshold usage level are high churn risk.
Run a randomized trial: assign new month-to-month customers to either (A) standard onboarding or (B) enhanced onboarding with proactive outreach, setup calls, and usage monitoring. Measure 90-day churn. If enhanced onboarding drops churn by 10+ percentage points, it's worth scaling.
The heatmap also shows long-tenure month-to-month customers stabilize. After 24 months on month-to-month, churn drops to ~20-25%—still higher than contracted customers but much lower than new month-to-month. These are habitual customers. They value flexibility but aren't actively shopping. Don't over-invest in retaining them—they're already sticky. Focus on the high-risk early cohorts.
Interaction Effects Matter: Main effects (tenure alone, contract type alone) miss how variables combine. Tenure matters most for month-to-month customers. Contract type matters most for early-tenure customers. Always check cross-tabs and heatmaps to catch these conditional relationships.
How to Interpret Your Results
You've run the analysis. You have logistic regression coefficients, random forest importance scores, and cross-tabulated churn rates. Now what? Here's how to translate statistical output into retention strategy.
Step 1: Separate Actionable from Descriptive Drivers
Actionable drivers are variables you can change through intervention. Descriptive drivers identify high-risk segments but don't tell you what to do.
Actionable: Contract type (offer incentives to upgrade), payment method (migrate to auto-pay), add-on services (bundle or discount to increase attachment), onboarding quality (improve early experience).
Descriptive: Tenure (you can't make a new customer old), total charges (reflects tenure and pricing), demographics (age, location—hard to change).
Prioritize actionable drivers with large coefficients. Month-to-month contract and electronic check payment are both actionable and high-impact. These are your top retention levers.
Step 2: Calculate Expected Churn Reduction
Don't just look at statistical significance—estimate business impact. If you convert 1,000 month-to-month customers to one-year contracts, how much churn do you prevent?
Baseline month-to-month churn: 43%. One-year churn: 11%. Churn reduction per converted customer: 32 percentage points. Expected prevented churn: 1,000 × 0.32 = 320 customers. Multiply by average customer LTV to get retention ROI.
If LTV is $1,200 and it costs $100 in incentives to convert a customer to annual (e.g., one month free), your ROI is: (320 saved customers × $1,200 LTV) - (1,000 conversions × $100 cost) = $384,000 - $100,000 = $284,000 net gain. That's a 2.8x return.
Run this calculation for each actionable driver. Rank interventions by expected ROI. Test the top 3 in randomized experiments.
Step 3: Design Proper Retention Experiments
Observational churn analysis identifies correlates. To prove causality, you need randomized experiments. Here's the protocol:
- State your hypothesis: "Offering a 10% discount for annual commitment will reduce churn by at least 15 percentage points among month-to-month customers."
- Calculate sample size: Use a power calculator. To detect a 15-point churn difference with 80% power and α=0.05, you need ~200 customers per arm (400 total). Don't run underpowered tests.
- Randomize assignment: Use a random number generator to assign customers to treatment (discount offer) or control (no offer). Check that treatment and control groups are balanced on key covariates (tenure, current charges, service type).
- Set observation window: Measure churn over 90 days post-intervention. Too short and you miss delayed effects; too long and external factors confound results.
- Analyze intent-to-treat: Compare churn rates for all customers assigned to treatment vs. control, regardless of whether treatment customers accepted the discount. This preserves randomization and gives you the causal effect of the offer.
- Check statistical significance: Use a two-proportion z-test. If p < 0.05, you have evidence the intervention worked. If not, either the effect is smaller than expected or your sample size was too small.
Did you randomize? This is the question that separates correlation from causation. If you just offered discounts to high-risk customers (identified by propensity scores), you've introduced selection bias—high-risk customers churn more regardless of treatment. Randomization breaks the selection mechanism and isolates the causal effect.
Step 4: Monitor Driver Stability Over Time
Churn drivers aren't static. What mattered last quarter may not matter today. Re-run your analysis quarterly and track coefficient changes.
Set up monitoring alerts: if your overall churn rate moves >2-3 percentage points, re-run the driver analysis immediately. A sudden churn spike may be driven by a new factor (e.g., competitor launched, pricing changed, service outage).
Track driver importance over time. If contract type was your #1 driver in Q1 but drops to #4 by Q3, something changed. Maybe you successfully shifted customers to annual contracts (reducing variance in that variable), or maybe a new driver (e.g., service quality issues) emerged. Investigate.
Working on this for your business? See the churn analysis tool.
See the Full Analysis in Action
Explore an interactive case study with all six analysis cards, drill-down filters, and exportable data tables. See how churn drivers come together in a complete analysis.
View Full Interactive Report →Common Mistakes and How to Avoid Them
Mistake 1: Confusing Correlation with Causation
Tenure correlates negatively with churn. Does longer tenure cause lower churn, or do low-risk customers self-select into longer tenure? Both. You can't randomly assign tenure, so the causal arrow is ambiguous. Use tenure as a risk segmentation variable (new customers need more attention), but don't claim you can "increase tenure to reduce churn" without testing an intervention that actually keeps customers longer.
Mistake 2: Running Underpowered Experiments
You test a retention email on 50 customers and see 5% lower churn. Is that real or noise? Calculate power. A 50-person test has maybe 30% power to detect a 5-point effect—you'll miss true effects 70% of the time. Either increase sample size or widen your detection threshold. What's your minimum detectable effect before we start? Agree on this upfront.
Mistake 3: Ignoring Interaction Effects
Main effects tell you "on average, contract type matters." But maybe contract type only matters for high-price customers or only in the first 6 months. Check interactions in cross-tabs and heatmaps. If you find strong interactions, segment your retention strategy—don't offer the same intervention to all customers.
Mistake 4: Overfitting on Noise
Random forest can overfit, especially with small samples or many irrelevant features. If a variable ranks high in random forest but has no logical mechanism, it's probably spurious. Example: if "customer ID ends in 7" ranks high, that's noise. Cross-validate your random forest model—check out-of-sample performance. If importance scores shift dramatically between training and test sets, you're overfitting.
Mistake 5: Not Validating on Holdout Data
Build your models on 70% of data, test on the remaining 30%. Do the same drivers emerge? Do predicted churn probabilities match observed churn rates in the holdout set? If your model performs well in-sample but fails out-of-sample, you've overfit. This is especially critical for random forest, which can memorize training data.
When Churn Driver Analysis Isn't Enough
Churn drivers tell you who churns and which variables correlate. They don't tell you:
- Why customers churn (their reasons, pain points, competitive alternatives). For that, run win-back surveys and exit interviews.
- Which retention offers work (discount vs. feature upgrade vs. service improvement). Test these in randomized experiments.
- Customer lifetime value by segment (retaining a $50/month customer is different from retaining a $200/month customer). Combine churn analysis with customer lifetime value modeling.
- Leading indicators of churn (usage drops, support tickets, payment failures). Build a churn early-warning system with behavioral signals, not just demographic features.
Use churn driver analysis as the foundation, then layer in qualitative research, experimentation, and predictive monitoring. The full retention stack combines all three.
From Insight to Action: Building a Retention Roadmap
You've identified your top churn drivers. Here's how to turn that into a 90-day retention roadmap:
- Week 1-2: Prioritize interventions. Rank actionable drivers by estimated ROI. Pick the top 3. For each, draft a specific intervention (e.g., "Offer 1 month free for annual commitment upgrade").
- Week 3-4: Design experiments. Write hypotheses, calculate required sample sizes, set up randomization infrastructure. Get stakeholder buy-in on running proper tests (no cherry-picking treatment groups).
- Week 5-10: Run experiments. Launch treatment and control arms. Monitor enrollment, check balance, watch for implementation issues. Don't peek at results early—wait for the pre-specified observation window.
- Week 11-12: Analyze results. Calculate intent-to-treat effects, check significance, estimate cost-benefit. If the experiment worked, plan scale-up. If it failed, diagnose why (wrong lever, insufficient dose, implementation failure).
- Week 13+: Scale winners, iterate on losers. Roll out successful interventions to the full customer base. Re-test failed interventions with modifications (different offer amount, different customer segment, different messaging).
Quarterly, re-run the churn driver analysis. Track how driver rankings change as you roll out interventions. If contract type was your #1 driver but you successfully migrated 50% of month-to-month customers to annual, it may drop in importance—not because it stopped mattering, but because you reduced variance in that variable. That's success.
Frequently Asked Questions
Should I use logistic regression or random forest for churn driver analysis?
Use both. Logistic regression gives you interpretable coefficients with statistical significance tests—critical for understanding which features truly move churn probability and by how much. Random forest captures non-linear interactions and ranks variables by importance. Side-by-side comparison reveals where linear assumptions hold and where they break down. If both methods agree a variable matters, you have convergent evidence.
What's the minimum sample size I need for reliable churn driver analysis?
You need at least 10-15 churn events per predictor variable in your logistic regression model. If you're testing 10 variables, that's 100-150 churned customers minimum. For random forest, larger is better—aim for at least 500 total observations with balanced representation of churned and retained customers. Underpowered analysis will miss real drivers and flag noise as signal.
How do I know if a churn driver is actionable or just descriptive?
Ask: can we change this variable through intervention? Contract type is actionable—you can design incentives to shift customers from month-to-month to annual contracts. Tenure is descriptive—you can't make a 3-month customer into a 24-month customer. Focus retention spend on actionable drivers with large coefficients. Descriptive drivers help you identify high-risk segments but don't tell you what to do.
Why do some variables rank high in random forest but show weak effects in logistic regression?
Random forest captures non-linear effects and interactions that logistic regression misses. A variable may have weak main effects but strong conditional effects—it matters only for certain customer segments or in combination with other features. Check interaction terms in your cross-tabs. If tenure matters primarily for month-to-month customers, you'll see it in the heatmap even if the main effect is modest.
How often should I re-run churn driver analysis?
Quarterly for stable businesses, monthly if you're running active retention experiments or seeing market shifts. Churn drivers change as your product, pricing, and competitive environment evolve. Set up monitoring: if your overall churn rate moves more than 2-3 percentage points, re-run the analysis immediately. What drove churn last quarter may not be the primary lever today.
Related Articles
Customer Lifetime Value (CLV) Modeling
Combine churn probabilities with revenue forecasts to calculate expected customer lifetime value by segment.
Logistic Regression for Binary Outcomes
Deep dive into logistic regression mechanics, coefficient interpretation, and model diagnostics for churn and conversion analysis.
Random Forest Variable Importance Explained
Understand mean decrease in Gini impurity, permutation importance, and how to avoid overfitting in tree-based models.
Retention Cohort Analysis
Track how churn rates evolve over customer tenure and identify at-risk cohorts before they leave.