Real analyses on real data. Each one was generated by the MCP Analytics team — interactive in the browser, exportable as PDF, citable, and reproducible. Click any card to open the full live report.
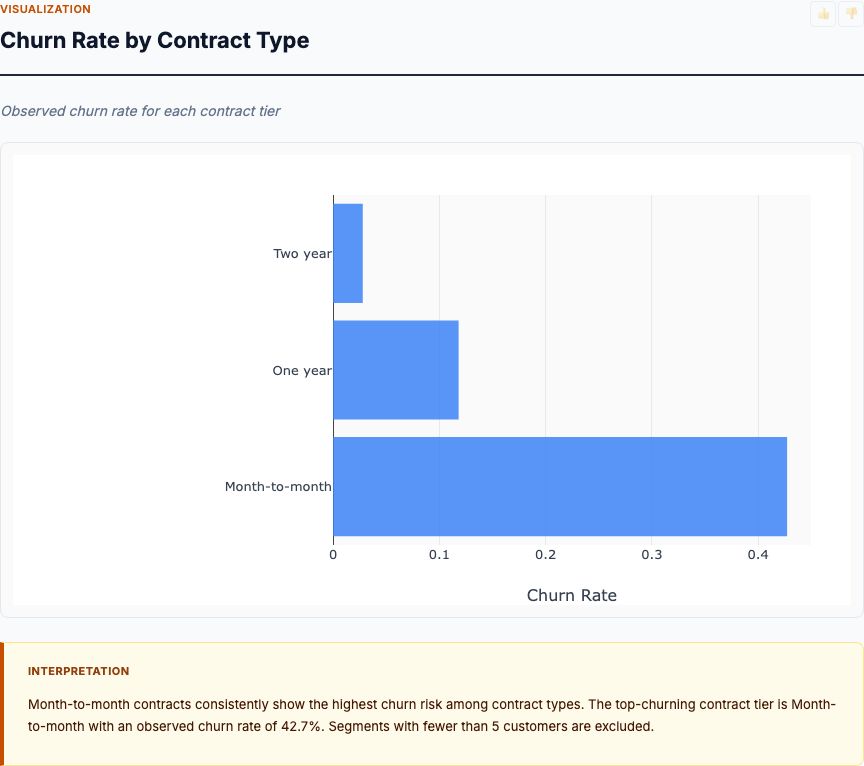
Logistic regression with feature importance, ranking the behavioral and demographic factors that predict whether a customer will churn.
View report →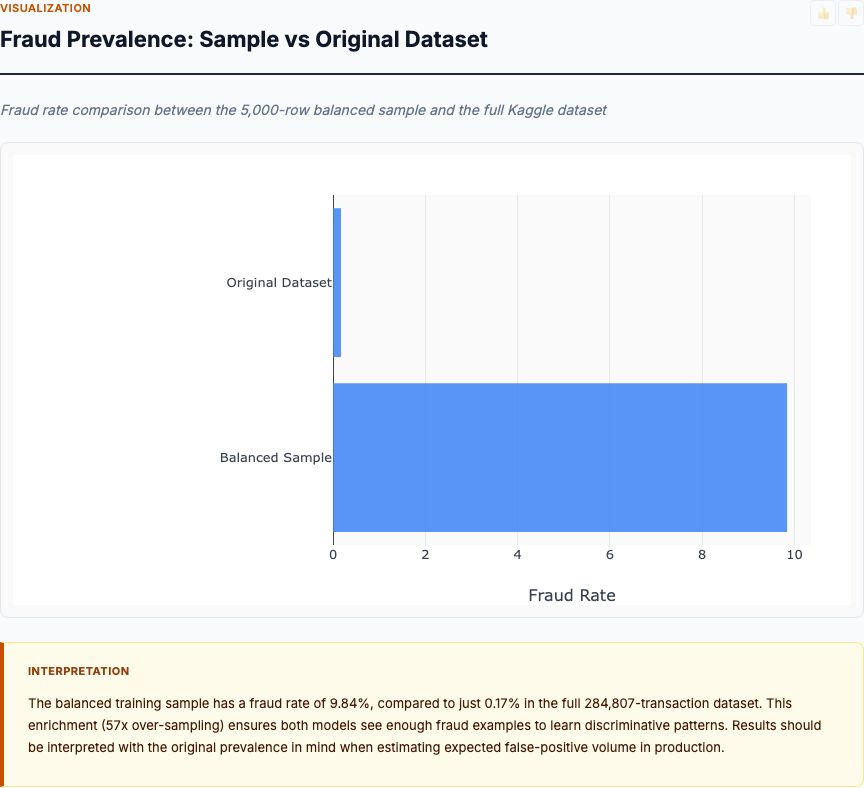
Isolation forest anomaly scoring on transaction features, surfacing the highest-risk outliers with explanation by feature contribution.
View report →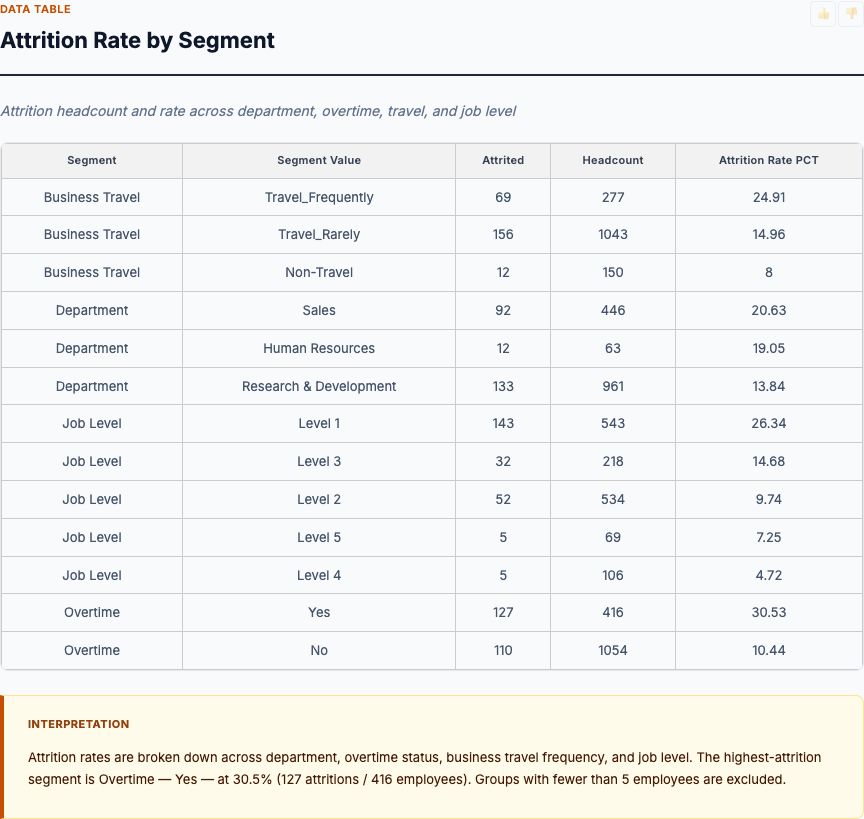
Logistic regression on attrition drivers — tenure, role, compensation, satisfaction — with odds ratios and a ranked driver list for retention planning.
View report →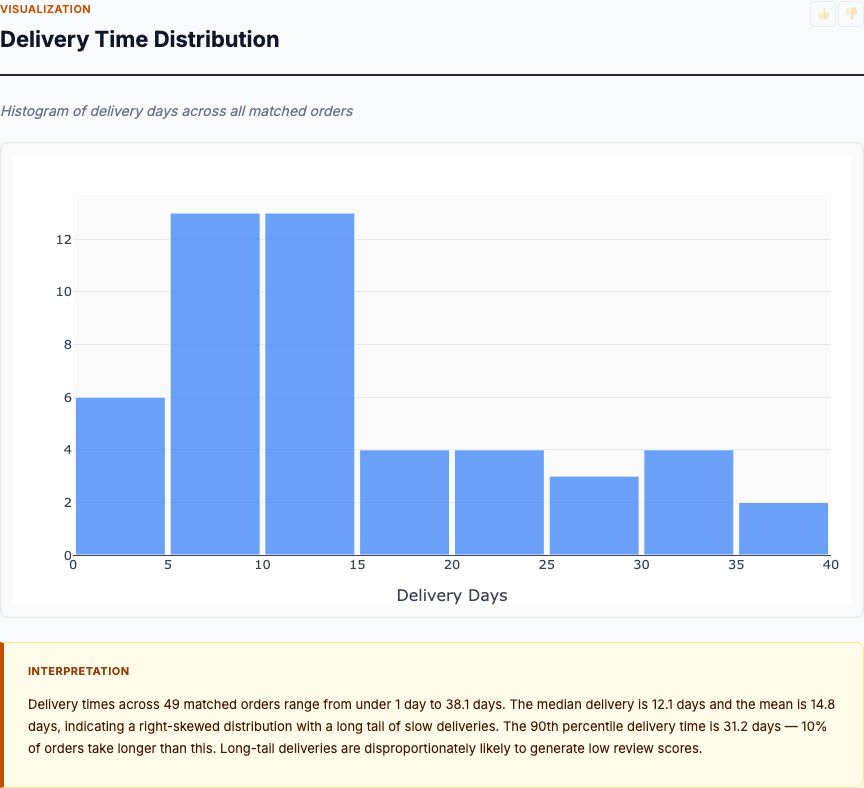
Regression analysis on order data identifying the delivery, timing, and fulfillment factors that most affect customer satisfaction scores.
View report →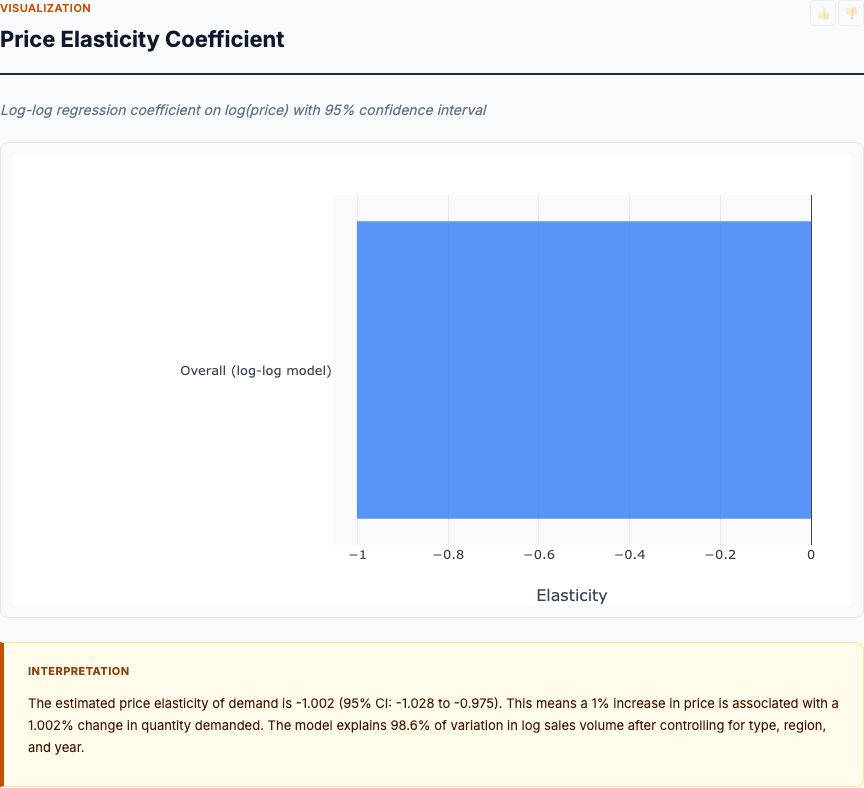
Price elasticity analysis on transaction data, estimating demand sensitivity by product category and identifying optimal pricing thresholds.
View report →Every analysis includes the same components designed for real-world decision making.
Zoom, pan, and hover over charts. Residual plots, Q-Q plots, feature importance, time-series decompositions, and correlation matrices.
R², RMSE, MAE, p-values, confidence intervals, AIC/BIC — every relevant statistic for the analysis type. Nothing hidden.
Plain-English interpretation that explains what the numbers mean. Key findings, recommendations, and actionable next steps.
APA, MLA, Chicago, BibTeX in one click — paste straight into a paper, deck, or compliance filing. Methodology and source travel with the citation.
Validated R source code is embedded in every report. A skeptical reader can rerun it and get the same answer.
Fixed seeds, Docker isolation, validated R. Same input → same output on any machine, any day, forever.
Upload a CSV or connect a live source. Describe what you want to know. The team builds, validates, and ships the report.